Monitoring System Health of Resources
On this page, you can view system and network health in Aviatrix CoPilot from Settings > Resources > System Health. You can select the resources and metrics you want to monitor.
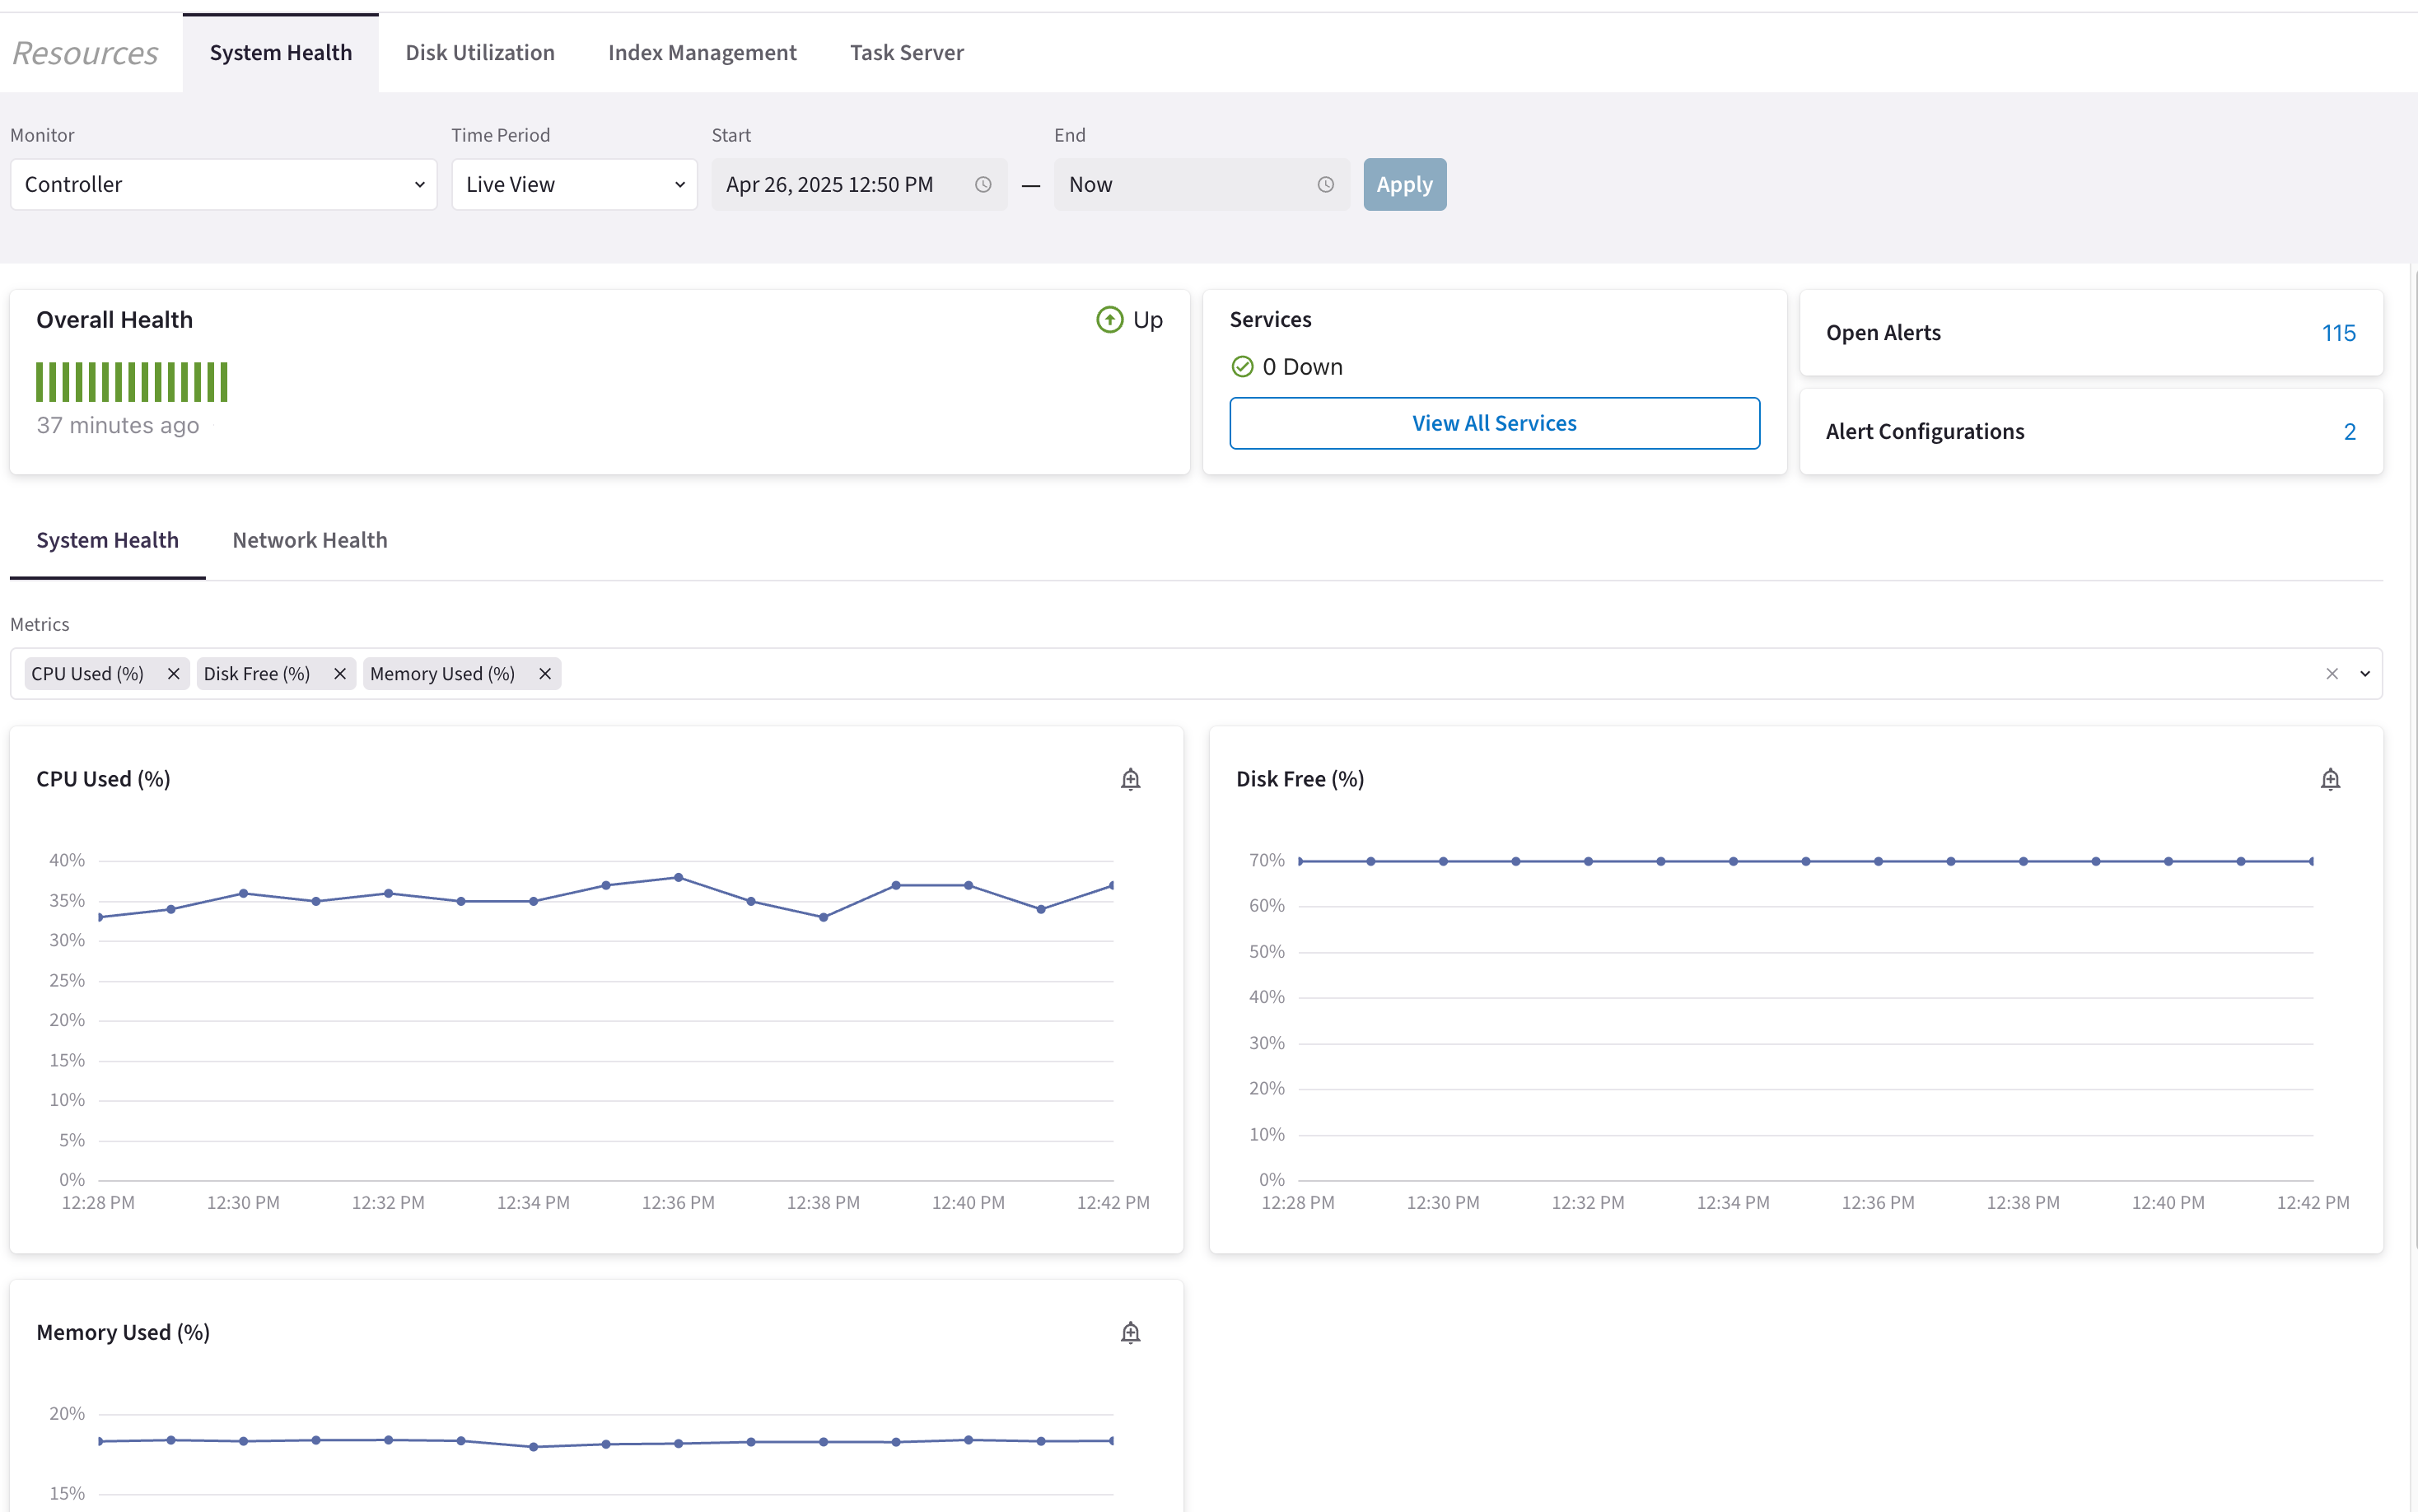
Configure Resources and Time Period
Overall Health
The overall health diagram provides a general overview of system health using visual and textual indicators. The vertical bar chart displays recent performance trends, with green bars representing a healthy state. Hovering over a bar reveals detailed metrics, providing insight into resource utilization at that time.
The overall status label in the top-right corner reflects system health:
-
Up — Green icon, indicating a healthy status.
-
Degraded — Yellow icon, indicating a degraded status.
-
Down — Red icon, indicating a critical status.
Services
Under Services, you can see how many services are currently in a Down state for the selected resource.
Clicking View All Services opens a list of all monitored services for the selected resource. You can also restart services from this list.
Open Alerts and Alert Configurations
If you selected Controller or CoPilot as the resource, you can view the total number of Open Alerts and Alert Configurations in your environment.
Clicking either total opens a list with further details. You can click View in Alerts to navigate to Notifications and see the alert details.
In the Alert Configuration popup, you can also click View in Alert Configurations to access your configured alerts in Notifications.
System Health and Network Health
The Controller has two sub-tabs, allowing you to view System Health and Network Health separately. CoPilot and CoPilot data disk resources display only the System Health sub-tab.
Clicking in the Metrics field shows a list of available metrics for the selected resource. Below the metrics list, graphs provide detailed visualizations for the selected metrics. By default, CPU Used (%), Disk Free (%), and Memory Used (%) are displayed.
Each graph includes an alert icon. Clicking the icon opens a Create Alert Configuration dialog box.
| It is recommended to upgrade the virtual machine size if Aviatrix platform global health alerts are triggered frequently. |
System Health Services
Clicking the Services > View All Services button opens a dialog box displaying the status of services for the selected resource.
When Controller is selected, the following services are displayed:
-
CLOUDXD
-
PKI
-
PERFMON
-
RSyslog
-
GlobalConfigDB
-
MongoDB
-
ConduitDaemon
When CoPilot is selected, the following services are displayed:
-
db
-
etl
-
web
-
CoPilot
-
Cache Server
-
Task Server
-
Update Agent
-
Topology Service
-
Metrics Service
-
CoPilot Udp Tunnel
In a cluster environment, when a CoPilot Data Disk is selected, the following services are displayed:
-
db
-
web
-
CoPilot
-
Update Agent
-
Topology Service
-
Metrics Service
-
CoPilot Udp Tunnel
System Health Metrics
Below are the system health metrics you can monitor:
| Name (System Metric) | Description | Internal Metric Name | Accessible by API |
|---|---|---|---|
CPU Idle (%) |
Of the total CPU time, the percentage of time the CPU(s) spent idle and waiting for tasks from the kernel. |
cpu_idle |
|
CPU Kernel Space (%) |
Of the total kernel space memory on the host (VM/instance), the percentage of time spent running kernel code. |
cpu_ks |
|
CPU Steal (%) |
Of the average CPU wait time on the host (VM/instance), the percentage of time a virtual CPU waits for a real CPU while the hypervisor services another virtual processor. |
cpu_steal |
|
CPU Used (%) |
The percentage of CPU used. |
cpu_used_per |
|
CPU User Space (%) |
Of the total CPU time, the percentage of time spent running non-kernel code. |
cpu_us |
|
CPU Wait (%) |
Of the total CPU time, the percentage of time spent waiting for IO. |
cpu_wait |
|
Disk Free |
The storage space on the disk (volume) that is free/unused. |
hdisk_free |
|
Disk Free (%) |
Of the total storage space on the disk (volume), the percentage of storage space that is free/unused. |
hdisk_free_per |
|
Disk Total |
The total storage space on the disk (volume). |
hdisk_tot |
|
IO Blocks In |
The number of blocks received per second from a block device. |
io_blk_in |
|
IO Blocks Out |
The number of blocks sent per second to a block device. |
io_blk_out |
|
Memory Available |
The available amount of memory that can be allocated to new or existing processes. |
memory_available |
|
Memory Available (%) |
Of the total memory, the percentage of the available memory that can be allocated to new or existing processes. |
memory_available_per |
|
Memory Buffer |
The amount of memory used as buffers. |
memory_buf |
|
Memory Cache |
The amount of memory used as cache. |
memory_cached |
|
Memory Swapped |
If swapped is enabled, the amount of virtual memory used. |
memory_swpd |
|
Memory Total |
The total memory. |
memory_tot |
|
Memory Used |
The amount of memory used. |
memory_used |
|
Memory Used (%) |
Of the total memory, the percentage of memory used. |
memory_used_per |
|
Processes Uninterruptible Sleep |
The number of processes blocked waiting for I/O to complete. |
nproc_non_int_sleep |
|
Processes Waiting To Be Run |
The number of processes that are running or waiting for run time. |
nproc_running |
|
Swaps From Disk |
Memory that is swapped in every second from disk in kilobytes. |
swap_from_disk |
|
Swaps To Disk |
Memory that is swapped out every second to disk in kilobytes. |
swap_to_disk |
|
System Context Switches |
The number of context switches per second. |
system_cs |
|
System Interrupts |
The number of interrupts per second, including the clock. |
system_int |
Network Health Metrics
Only the Controller has the Network Health tab.
Below are the network health metrics you can monitor:
| Name (Network Metric) | Description | Internal Metric Name | Accessible by API | ||
|---|---|---|---|---|---|
Bandwidth Egress Limit Exceeded |
Bandwidth Egress Limit Exceeded |
bandwidth_egress_limit_exceeded |
|||
Bandwidth Egress Limit Exceeded (%) |
Bandwidth Egress Limit Exceeded (%) |
per_bandwidth_egress_limit |
|||
Bandwidth Egress Limit Exceeded Rate |
The number of tx packets dropped because the bandwidth allowance limit was exceeded. This metric is supplied by the Elastic Network Adapter (ENA) driver only on AWS. |
rate_bandwidth_egress_limit_exceeded |
|||
Bandwidth Ingress Limit Exceeded |
Bandwidth Ingress Limit Exceeded |
bandwidth_ingress_limit_exceeded |
|||
Bandwidth Ingress Limit Exceeded (%) |
The percentage of dropped rx packets due to exceeding the bandwidth allowance limit. This metric is specific to the ENA driver on AWS. |
per_bandwidth_ingress_limit_exceeded |
|
||
Bandwidth Ingress Limit Exceeded Rate |
(AWS Only) Bandwidth Ingress Limit Exceeded Rate — The number of rx packets dropped because the bandwidth allowance limit was exceeded. This metric is supplied by the ENA driver only on AWS. |
rate_bandwidth_ingress_limit_exceeded |
|||
Collisions during Transmission |
The count of collisions during packet transmission. |
tx_colls |
|||
Collisions Rate during Transmission |
The number of collisions per second during packet transmission. |
rate_tx_colls |
|||
Compressed Packets Received |
The count of compressed packets received. |
rx_compressed |
|||
Compressed Packets Received Rate |
The number of compressed packets received per second. |
rate_rx_compressed |
|||
Compressed Packets Transmitted |
The count of correctly received compressed packets. |
tx_compressed |
|||
Compressed Packets Transmitted Rate |
The number of correctly received compressed packets per second. |
rate_tx_compressed |
|||
Conntrack Allowance Available |
(AWS Only) Reports the number of available tracked connections that can be established before an instance’s Connections Tracked allowance is exceeded. This metric is supplied by the Elastic Network Adapter (ENA) driver only on AWS. |
conntrack_allowance_available |
|||
Conntrack Limit Exceeded |
Conntrack Limit Exceeded |
conntrack_limit_exceeded |
|||
Conntrack Limit Exceeded (%) |
Conntrack Limit Exceeded (%) |
per_conntrack_limit_exceeded |
|||
Conntrack Limit Exceeded Rate |
Conntrack limit exceeded rate. |
rate_conntrack_limit_exceeded |
|||
Conntrack Usage Rate |
(AWS Only) The rate at which conntrack capacity is being used up in connections per second. The Conntrack Usage Rate metric is only available in AWS where the Conntrack Allowance Available (conntrack_allowance_available) metric is present. |
conntrack_usage_rate |
|||
Drop Rate during Transmission |
The number of packets being dropped per second while sending. |
rate_tx_drop |
|
||
Drop Rate while Receiving |
The number of packets being dropped per second while receiving. |
rate_rx_drop |
|
||
Errored Packets Received |
The count of packets received that is flagged by the kernel as errored. |
rx_errs |
|||
Errored Packets Received Rate |
The number of packets received per second that is flagged by the kernel as errored. |
rate_rx_errs |
|||
Errored Packets Transmitted |
The total number of transmit problems. |
tx_errs |
|||
Errored Packets Transmitted Rate |
The total number of transmit problems per second. |
rate_tx_errs |
|||
Interface Drops during Transmission (%) |
Interface Drops during Transmission (%) |
per_tx_drop |
|||
Interface Drops while Receiving (%) |
Interface Drops while Receiving (%) |
per_rx_drop |
|||
Interface Errors during Transmission (%) |
Interface Errors during Transmission (%) |
per_tx_errs |
|||
Interface Errors while Receiving (%) |
Interface Errors while Receiving (%) |
per_rx_errs |
|||
Limit Exceeded Rate (PPS) - AWS Only |
The number of packets that exceed the maximum for the instance type that are processed (bidirectionally) by the Aviatrix gateway per second. |
rate_pps_limit_exceeded |
|||
Linklocal Limit Exceeded |
Linklocal Limit Exceeded |
linklocal_limit_exceeded |
|||
Linklocal Limit Exceeded (%) |
Linklocal Limit Exceeded (%) |
per_linklocal_limit_exceeded |
|||
Linklocal Limit Exceeded Rate |
Linklocal Limit Exceeded Rate |
rate_linklocal_limit_exceeded |
|||
Multicast Packets Received |
Multicast Packets Received |
rx_multicast |
|||
Multicast Packets Received Rate |
The number of multicast packets per second. |
rate_rx_multicast |
|||
PPS Limit Exceeded |
The count of bidirectional packets that exceed the maximum for the instance type and are handled by the Aviatrix gateway. |
pps_limit_exceeded |
|
||
PPS Limit Exceeded Drop (%) |
PPS Limit Exceeded Drop (%) |
per_pps_limit_exceeded |
|||
Packet Drop (%) |
Packet Drop (%) |
per_pkt_drop |
|||
Packet Drop Rate |
The rate at which packets are dropped per second. |
rate_pkt_drop |
|
||
Packet Failure (%) |
Packet Failure (%) |
per_pkt_fail |
|||
Packet Failure Rate |
Packet Failure Rate |
rate_pkt_fail |
|||
Packets Dropped during Transmission |
The count of packets that were dropped during transmission, often due to resource constraints. |
tx_drop |
|
||
Packets Dropped while Receiving |
The count of received packets that were not processed, typically due to resource limitations or unsupported protocols. |
rx_drop |
|
||
Peak Received Rate |
Peak Received Rate |
rate_peak_received |
|||
Peak Total Rate |
Peak Total Rate |
rate_peak_total |
|||
Peak Transmitted Rate |
Peak Transmitted Rate |
rate_peak_sent |
|||
Received Bytes |
Received Bytes |
rx_bytes |
|||
Received Frames Rate |
Received Frame Rate
|
rate_rx_frame |
|||
Received Packets |
Received Packets |
rx_packets |
|||
Received Rate |
Received Rate |
rate_received |
|
||
Received Rate (PPS) |
Packets Received Rate — The total (received) transmission in packet level per second. |
pkt_rx_rate |
|||
Receiver FIFO Frames |
Receiver FIFO Frames |
rx_fifo |
|||
Receiver FIFO Frames Rate |
The number of overflow events per second when receiving packets. |
rate_rx_fifo |
|||
Received Frames |
Received Frames |
rx_frame |
|||
Total Attempted Rate |
Total Attempted Rate |
rate_pkt_attempted |
|||
Total Rate |
The total (bidirectional) rate of bits processed per second by the interface on the Aviatrix VM/instance. |
rate_total |
|
||
Total Rate (in packets) |
The total (bidirectional) transmission in packet level per second. Instance size impacts how many packets per second the gateway can handle. |
pkt_rate_total |
|||
Transmission FIFO Frames Rate |
The number of frame transmission errors per second due to device FIFO underrun/underflow. |
rate_tx_fifo |
|||
Transmission FIFO Frames |
The number of frame transmission errors due to device FIFO underrun/underflow. |
tx_fifo |
|||
Transmitted Bytes |
Transmitted Bytes |
tx_bytes |
|||
Transmitted Carrier Frames |
Transmitted Carrier Frames |
tx_carrier |
|||
Transmitted Carrier Frames Rate |
Transmitted Carrier Frames Rate |
rate_tx_carrier |
|||
Transmitted Packets |
Transmitted Packets |
tx_packets |
|||
Transmitted Rate |
The rate of bits per second that has been transmitted by the interface on the Aviatrix gateway VM/instance. |
rate_sent |
|
||
Transmitted Rate (PPS) |
Transmitted Rate (PPS) |
pkt_tx_rate |
Related Topics
For descriptions of the available metrics, see Metrics Monitored for Aviatrix Resources.
For information about alert notifications, see Notifications (Alerts) About Network Events.