Distributed Cloud Firewall Monitoring
The Security > Distributed Cloud Firewall > Monitor tab provides a view of the traffic that is being processed by the Distributed Cloud Firewall (DCF) rules.
You can enable logging when creating DCF rules.
| Log entries are throttled to a maximum of two logs per minute per connection, regardless of the traffic type and protocol. As a result, you may observe missing or delayed log entries on the Monitor tab. This behavior is by design to prevent the logging system from being overwhelmed and does not affect actual traffic transmission or performance. If you suspect missing logs, verify the DCF rule traffic count, which will record all the traffic hits on the rule. |
DCF Monitoring Table
Available columns are listed below (all available by default except where noted). You can filter the logs by any of these columns, and you can also sort the logs by any column.
| Column | Description |
|---|---|
Timestamp |
Reflects the time associated with each logged packet that matches a Distributed Cloud Firewall (DCF) rule with logging enabled. |
Rule |
The name of the DCF rule that was matched by the packet. <is this right?> |
Log Engine |
L4 or L7 inspection engine that processed the packet. This indicates whether the packet was inspected at Layer 4 (transport layer) or Layer 7 (application layer). |
Gateway (not shown by default) |
The gateway that processed the packet. This is useful for identifying which gateway handled the traffic. <true?> |
Source IP |
The source IP address of the packet. This is the IP address from which the packet originated. |
Destination IP |
The destination IP address of the packet. This is the IP address to which the packet is sent. |
SNI (not shown by default) |
The Server Name Indication (SNI) associated with the packet. This is relevant for TLS traffic and indicates the hostname that the client is trying to connect to. |
Decrypted By |
The entity that decrypted the packet, if applicable. This is relevant for packets that were decrypted by a DCF rule with TLS decryption enabled. |
URL |
The URL associated with the packet, if applicable. This is populated when decryption is enabled on a DCF rule that includes a WebGroup and the TLS Decryption option is enabled. |
Protocol |
The protocol used by the packet, such as TCP, UDP, or ICMP. This indicates the type of communication protocol used for the packet. |
Source Port |
The source port of the packet. This is the port number on the source IP address from which the packet originated. |
Destination Port |
The destination port of the packet. This is the port number on the destination IP address to which the packet is sent. |
Source MAC |
The source MAC address of the packet. This is the Media Access Control address of the device that sent the packet. |
Destination MAC |
The destination MAC address of the packet. This is the Media Access Control address of the device to which the packet is sent. |
Action |
The action taken on the packet by the DCF rule (Permit or Deny). This indicates whether the packet was allowed or blocked by the rule. |
Enforced |
Whether the rule was enforced (On) or not (Off). This indicates if the rule was actively applied to the packet. |
Reason |
The reason for the action taken on the packet. This provides additional context for why the packet was permitted or denied. <true?> |
Filtering and Views
You can filter on any of the above columns.
Click Save as New View or Save As after filtering your log data. You are prompted to enter a name for the view.
The saved views are then available from a second drop-down on the Performance page.
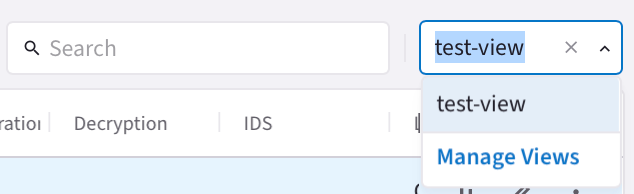
After selecting a saved view, you can:
-
Click Manage Views to view the Manage Views dialog. From here you can delete the view or apply it to the Monitor tab.
-
Clear it and select another saved view
-
Select new metrics/gateways and create or save another view
The available default views are:
-
Web Traffic: based on URL and SNI columns
-
All Logs
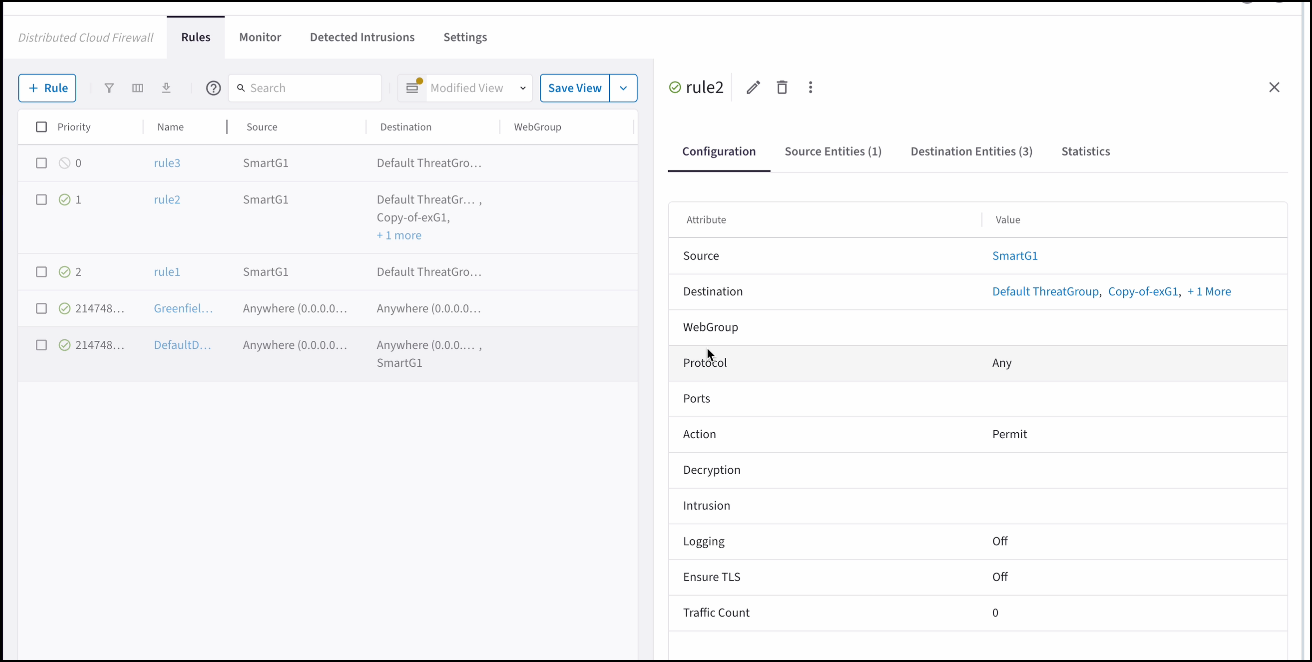
Monitoring Details
On the Monitor tab, click a rule name. This opens the Policies tab details page so that you can view the rule’s logging details.