Setting Up Webhook Channels for Sending Alert Notifications
This section describes how to set up webhooks in your CoPilot system so they can be selected as a notification channel when configuring user alerts. The section provides the following information:
-
How to specify webhook payload URLs in your CoPilot system.
-
How to customize the webhooks Aviatrix CoPilot generates for sending to external systems (such as Slack and PagerDuty). See "CoPilot Webhooks Customization".
-
An example for setting up PagerDuty to receive CoPilot alerts via webhooks. See "Example: PagerDuty Webhook Payload URL".
Specifying the Webhook Payload URL
This section describes how to set up the webhook payload URLs in your CoPilot system so they can be selected as a notification channel when configuring user alerts.
-
Go to Monitor > Notifications > Recipients tab and click Webhooks to open the Webhooks pane.
-
Click the + Webhook button.
-
For Alias, enter the name or alias of the person or team who will receive the alert notification.
-
For Webhook Payload URL, type the URL of the server who will receive the webhook POST request of the alert notification.
-
(Optional) Set an authorization header. Passing a custom authorization header may be used for integrating with downstream third-party alerting systems. When set, the contents are included in the header of the webhook request as:
Authorization: <value typed in Authorization Header field>
-
(Optional) Set a secret for use in authenticating CoPilot as the sender of the POST requests.
-
(Optional) Set a tag or label to be sent in the payload for use to integrate with your system.
-
Click Save.
The webhook payload URL is saved and is now available for selection when configuring CoPilot user alerts.
Testing a CoPilot Webhook
To test a CoPilot webhook:
-
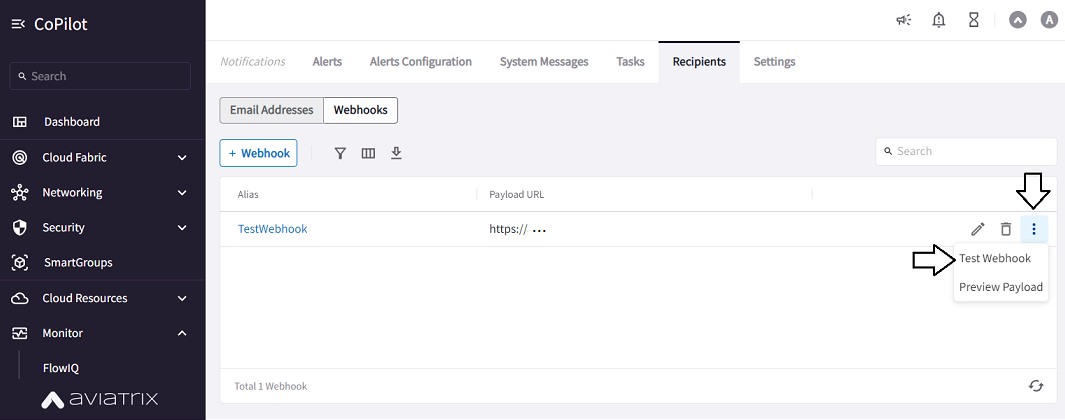
Go to CoPilot > Monitor > Notifications > Recipients.
-
Click the Webhooks tab.
-
In the table, locate the CoPilot webhook you previously created that you want to test.
-
Click the vertical ellipsis and select Test Webhook.
-
The webhook is tested with an example alert to check that the webhook is configured correctly. Note that CoPilot does not simulate a real condition for this test.
CoPilot Webhooks Customization
You can customize the webhooks Aviatrix CoPilot generates for sending to external systems (such as Slack) by using the Handlebars templating language. Examples are provided in this topic for high level variables that are exposed in CoPilot notification alerts.
Variables in CoPilot alerts used in webhook customization
CoPilot alerts expose the following high level variables (objects):
-
alert
-
event
-
webhook
Each object exposes additional variables that can be accessed.
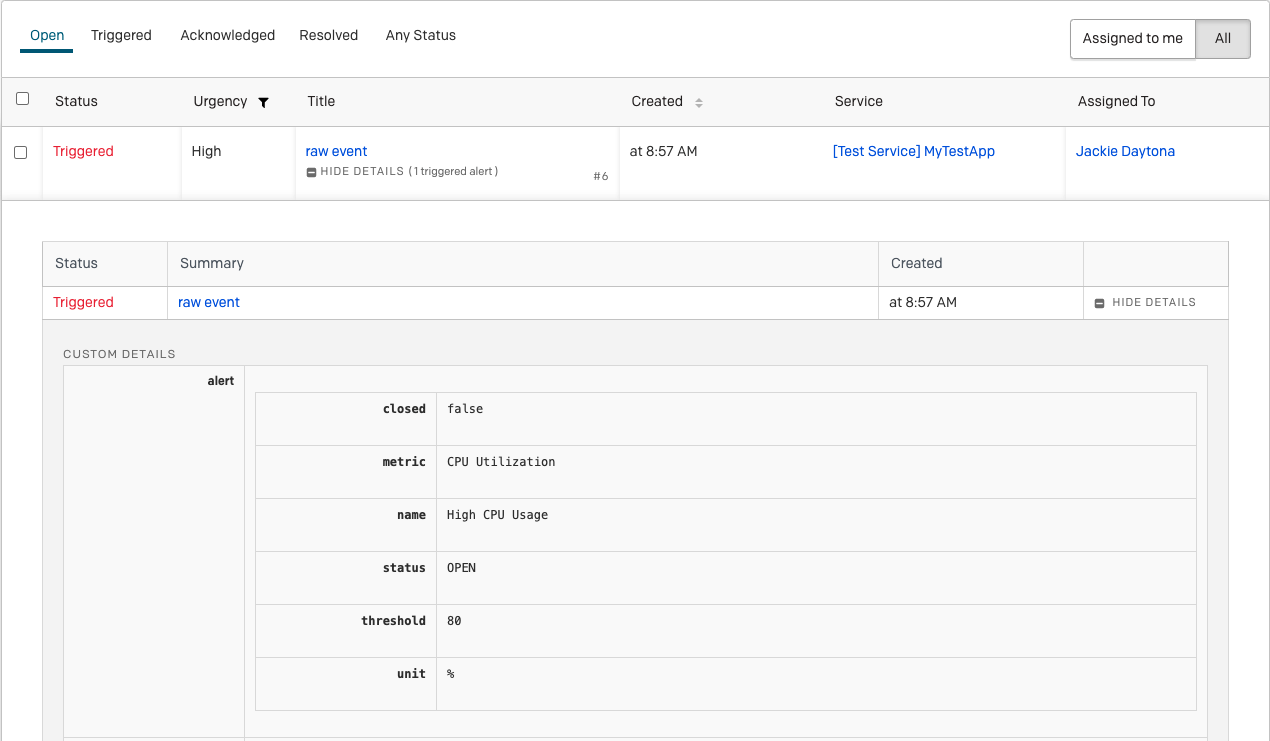
Alert
The alert object exposes :
"alert": {
  "closed": false,
  "metric": "CPU Utilization",
  "name": "High CPU Usage",
  "status": "OPEN",
  "threshold": 80,
  "unit": "%"
}
Event
The event object exposes :
"event": {
  "receiveSeparateAlert": false,
  "exceededOrDropped": "Exceeded",
  "newlyAffectedHosts": ["spoke1", "spoke1-hagw"],
  "recoveredHosts": ["spoke2"],
  "message": "Alert Updated",
  "timestamp": "2021-05-22T17:49:20.547Z"
}
where:
-
newlyAffectedHostsrepresents the hosts that are now affected but were not affected before. These hosts usually need the user’s attention the most. -
recoveredHostsrepresents the hosts that are now recovered. -
receiveSeparateAlertis for individual host alerts.
Webhook
The webhook object exposes :
"webhook": {
  "name": "",
  "secret": "",
  "tags": [],
  "url": ""
}
Creating a custom webhook and accessing individual fields
Example 1: If individual alerts for hosts is ON, receive a string. Else receive an array. :
{
  "status": "{{#if alert.closed}}ok{{else}}critical{{/if}}",
  "check": {{alert.name}},
  "copilotstatus": {{alert.status}},
  "host": {{#if event.receiveSeparateAlert}}
  {{#if event.newlyAffectedHosts}}
    {{event.newlyAffectedHosts.[0]}}
  {{else}}
    {{event.recoveredHosts.[0]}}
  {{/if}}
{{else}}
  {{#if event.newlyAffectedHosts}}
    {{event.newlyAffectedHosts}}
  {{else}}
    {{event.recoveredHosts}}
  {{/if}}
{{/if}},
  "alert_timestamp": "Received <<alert.metric>> at <<event.timestamp>>"
}
Example 2 :
{
"myAlert": {{alert.name}},
"triggeredAt": {{event.timestamp}},
"eventMessage": {{event.message}},
"triggeredMetric": {{alert.metric}},
"status": {{alert.status}},
"webHookName": {{webhook.name}},
"webHookTags": {{webhook.tags}}
}
Output: :
{
"myAlert": "High CPU Usage",
"triggeredAt": "2021-05-22T18:06:34.143Z",
"eventMessage": "Alert Updated",
"triggeredMetric": "CPU Utilization",
"status": "OPEN",
"webHookName": "test",
"webHookTags": [
"customTag"
]
}
Templates support JSON and String formatted output as values.
In situations where you want to specifically format the value of an output, it needs to be converted from JSON (default) to a string value.
“webhook”: \{{webhook}}→ produces JSON: :
{
"webhook": {
"name": "",
"secret": "",
"tags": [
"test",
"123",
"emergency"
],
"url": ""
}
}
“webhook”: “[webhook]” → produces STRING: :
{
  "webhook": "{\n  \"name\": \"\",\n  \"secret\": \"\",\n  \"tags\": [\n    \"test\",\n    \"123\",\n    \"emergency\"\n  ],\n  \"url\": \"\"\n}"
}
String escaped values allow for custom messages to be used in values. :
{
  "webhook": "My Custom Webhook message <<webhook>>"
}
Output: :
{
  "webhook": "My Custom Webhook message {\n  \"name\": \"\",\n  \"secret\": \"\",\n  \"tags\": [\n    \"test\",\n    \"123\",\n    \"emergency\"\n  ],\n  \"url\": \"\"\n}"
}
Looping over lists in templates using #attribute… . …/attribute. Any
content between the # and / is expanded once for each list item, and the
special attribute . can be used to refer to it.
Some attributes refer to a list of results:
-
webhook.tagslist of optional user-defined strings, configured on a per-webhook basis. -
event.newlyAffectedHostsrepresents the hosts that are now affected but were not affected before. These hosts usually need the user’s attention the most. -
event.recoveredHostsrepresents the hosts that are now recovered.
{
  "webHookTags": {{webhook.tags}}
}
Output: :
{
  "webHookTags": [
    "customTag",
    "Slack",
    "Emergency"
  ]
}
If you want to customize the output for list items: :
{
  "webhook": "<<#webhook.tags>> tag:<<.>> <</webhook.tags>>"
}
Output: :
{
  "webhook": " tag:test  tag:123  tag:emergency "
}
Escaping quotes for return values when creating custom values is performed automatically for strings within << >>.
{{{some_quoted_var}}} disables escapes altogether, which should be
avoided, as it can unexpectedly cause embedded strings to form invalid
JSON, for example, an alert name of A “great” alert, quotes, newlines,
tabs, and so on are not allowed in JSON strings.
Input: :
{
  "alertStatus": "Name:{{{alert.name}}} Metric:{{{alert.metric}}} alert"
}
Output: :
{
  "alertStatus": "Name:High CPU Usage Metric:CPU Utilization alert"
}
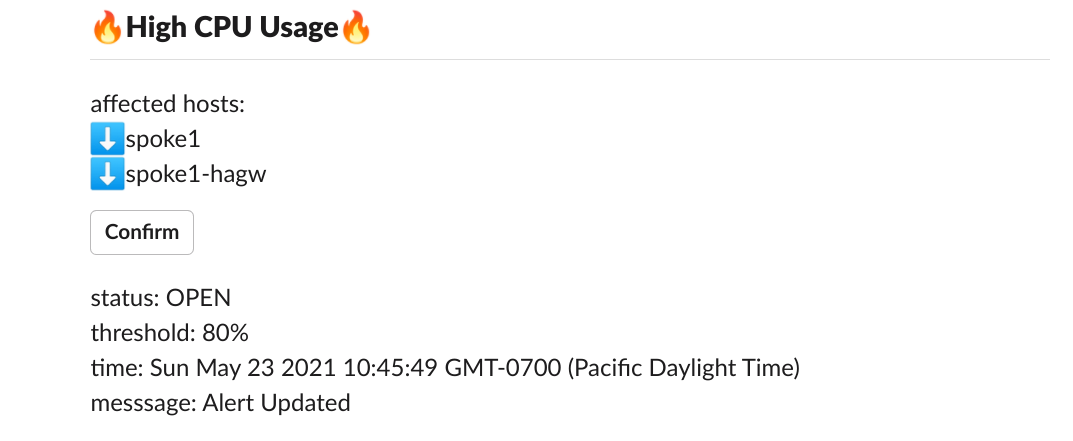
Custom Slack Webhook example (slack document: https://app.slack.com/block-kit-builder/): :
{
  "blocks":[
    {
      "type":"header",
      "text":{
        "type":"plain_text",
        "text":":fire:<<alert.name>>:fire:"
      }
    },
    {
      "type":"divider"
    },
    {
      "type":"section",
      "text":{
        "type":"mrkdwn",
        "text":"newly affected hosts:\n <<#event.newlyAffectedHosts>>:arrow_down:<<.>>\n<</event.newlyAffectedHosts>>"
      }
    },
    {
      "type":"actions",
      "elements":[
        {
          "type":"button",
          "text":{
            "type":"plain_text",
            "text":"Confirm",
            "emoji":true
          },
          "value":"click_me_123",
          "action_id":"actionId-0"
        }
      ]
    },
    {
      "type":"section",
      "text":{
        "type":"mrkdwn",
        "text":"status: <<alert.status>>\nthreshold: <<alert.threshold>><<alert.unit>>\ntime: <<event.timestamp>>\nmesssage: <<event.message>>"
      }
    }
  ]
}
Example: PagerDuty Webhook Payload URL
If you want to set up PagerDuty to receive CoPilot alerts via webhooks, this section provides an overview of the steps including generating the PagerDuty webhook payload URL to which CoPilot will send POST requests. You specify the URL when you configure CoPilot notifications in Settings > Notifications > Webooks.
For the most current information about receiving HTTP callbacks in your PagerDuty account, always refer to the PagerDuty support documentation.
Prerequisite: Before you begin, create a PagerDuty developer account at the PagerDuty Developer Platform site.
Summary of Steps:
-
(In PagerDuty) Log in to your PagerDuty Developer Console.
-
(In PagerDuty) Create the PagerDuty application service.
-
(In CoPilot) Configure CoPilot notifications via webhooks to send alerts to your new service.
To set up PagerDuty to receive CoPilot alerts via webhooks:
-
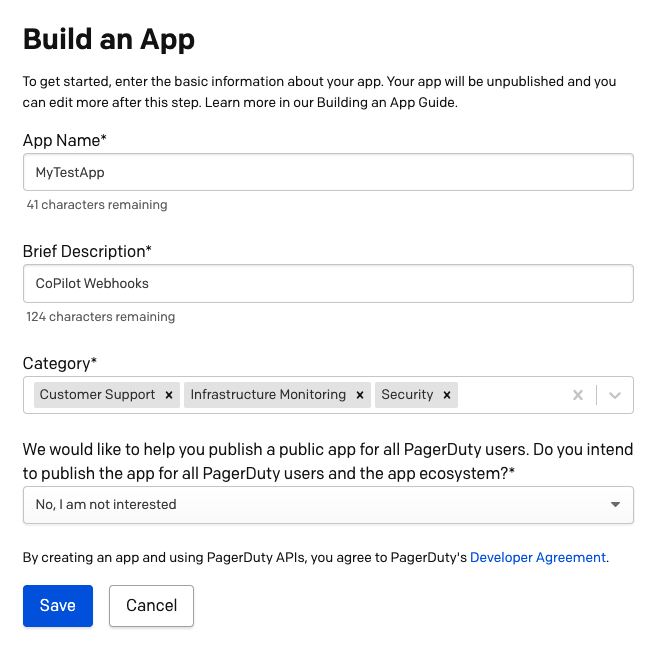
Log in to your PagerDuty Developer Console and click Create New App.
If you do not see the Create New App button after logging in, navigate to Integrations > Developer Mode from the console menu.

-
Fill in the requested fields, such as App Name, Brief Description, and Category (you can specify multiple values for the category field):
-
Click Save.
-
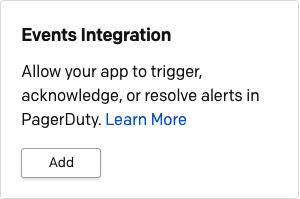
In the next page, locate the Events Integration box, and click Add.
-
Fill in the requested fields:
-
Transform Event Data: Yes
-
Debug Mode: Off (or on, if preferred)
-
Change Events: Not required
-
Redirect URLs: Not required
-
-
For Create a Test Service, modify the pre-populated value if preferred and click Create.
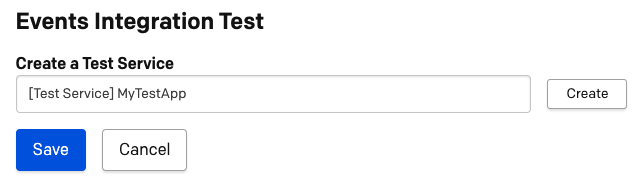
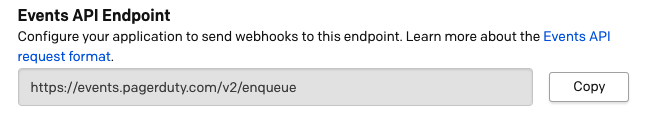
After you click Create, your Integration Key and API Endpoint are created but the API Endpoint URL is not correct until you click Save. Before you save the service, the endpoint looks like this:
-
Click Save to save the test service.
After saving the service, your endpoint looks like this:
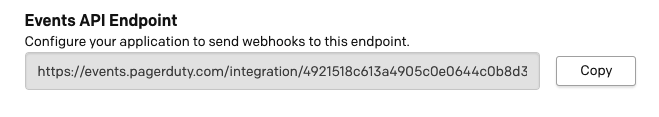
The page refreshes and reverts back to the main screen for your new application.
-
Locate the Events Integration box, and click Manage.
-
Copy the Events API Endpoint.
-
Log in to CoPilot.
-
Go to Monitor > Notifications > Recipients tab and scroll down to the end of the Webhooks section.
-
Click + New to create a webhook configuration for PagerDuty.
-
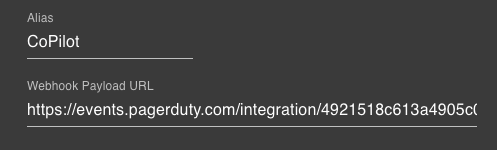
In the webhook configuration panel, fill in the fields. For Webhook Payload URL, paste your copied Events API Endpoint URL.
-
Click the Test button on the webhook test payload.
This sends a test to PagerDuty. If the test is successful, you will see a Success message:

To see the alert in PagerDuty, follow the next step.
-
(Verify Alert Sent) In PagerDurty, click on your profile icon in the app bar and select Subscriptions.
-
In the top menu, click Incidents.
You should see your alert. For example:
Note About Webhooks Migrated to 3.7.1
3.7.1 offers a new Alert UI that provides the ability to configure multi-metric conditions for alerts. Existing webhooks were for single condition alerts.
The Webhook Format contains the following new fields:
-
alert.defId: The id of the alert that sends out the webhook
-
alert.metrics: An array of strings that contains all the metric(s) the alert has. i.e. ['CPU Used (%)', 'Memory Used (%)', 'Disk Free (%)']
-
alert.version: This field is always 'v2'. It’s used to distinguish from the previous webhook format.
-
alert.query: This field is a more detailed version of alert.metrics. For each metric, it also has its duration, comparator, threshold, and unit.
For example:
[ { duration: 15, comparator: 'more than', metric: 'cpu_used_per', threshold: 90, unit: 'Percent' }, { duration: 15, comparator: 'more than', metric: 'memory_used_per', threshold: 90, unit: 'Percent' }, { duration: 15, comparator: 'less than', metric: 'hdisk_free_per', threshold: 5, unit: 'Percent' } ] -
event.condition: This is a human-readable string that explains when the alert would be triggered.
For example:
'(CPU Used (%) more than 90%) OR (Memory Used (%) more than 90%) OR (Disk Free (%) less than 5%) '
Pre-existing webhooks are migrated to contain the new format. Existing webhook high level objects remain the same.
The Webhook Format contains the following modifications on some old fields:
-
alert.metric: If the alert is a multi-metric alert, this field would be "Please refer to alert.query key".
-
event.exceededOrDropped: If the alert is a multi-metric alert, this field would be "Please refer to event.condition or alert.query key".
Any existing webhooks (for single condition alert) created prior to release 3.7.1 will have no changes to existing fields, and only new fields would be added. Newly added multi-metric alerts will have modifications to the two old fields as they are explained above.