Dashboard Overview
The Aviatrix Platform Dashboard provides a world map view of your network. Each VPC or VNet discovered by Aviatrix PaaS in your network is displayed.
Some information on the Dashboard is available only for resources that have been onboarded to Aviatrix PaaS. Where applicable, information on the Dashboard will be identified as the following:
-
Aviatrix-managed: Indicates that a VPC or VNet, and its associated resources, have been onboarded with Aviatrix, so they can be managed through Aviatrix PaaS, and a gateway exists in the VPC or VNet.
-
Unmanaged: Indicates the VPC or VNet and associated resources have not been onboarded with Aviatrix.
Geo View
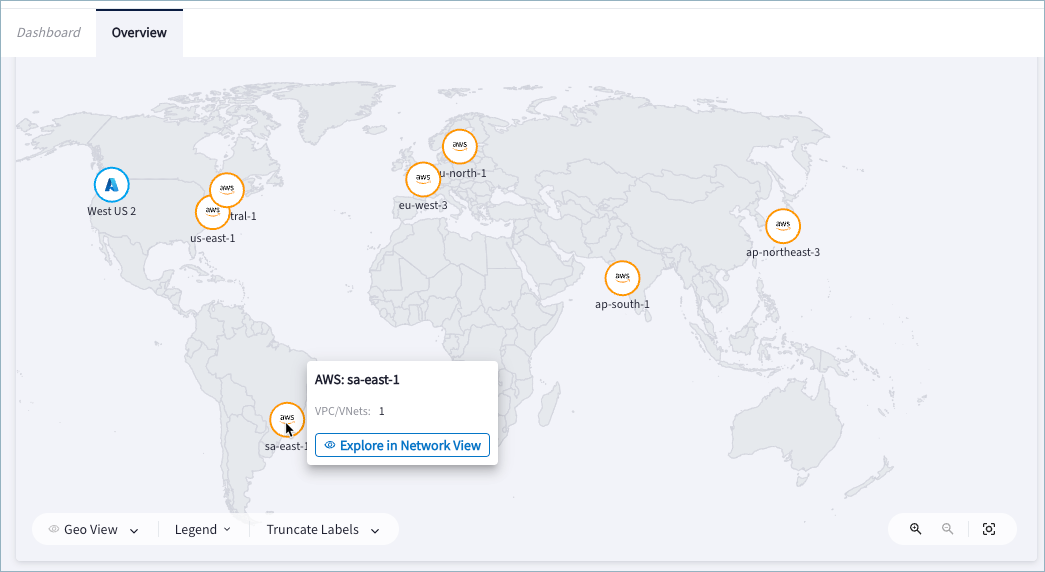
The geographic map shows the approximate locations of your VPCs and VNets across the globe. Both managed and unmanaged resources are represented on the map by badges of the associated CSP (AWS, Azure).
You can click on the badge for any region to display a popup. The popup shows the VPCs or VNets in the region and a link to Explore in Network View. This link opens the Network View in Cloud Fabric > Topology and displays just the resources of the selected region.
See Working with Topology for more information about the Topology page.
Below the Geo View map are menus that affect the map display.
Views
The default view for the Dashboard is Geo View. You can also switch to Network View, which opens the Cloud Fabric > Topology page.
Legend
Below the Dashboard map is a Legend that explains the meanings of the colored lines and icons in the map.
The colored lines in the Geo View map indicate:
-
Green solid line = Connected: all the connections between the regions are up.
-
Orange solid line = Partially Connected: some connections between the regions are up, and others are not.
-
Red solid line = Disconnected: all connections between the regions are down.
Feature Highlights
Immediately below the Dashboard map is an Explore More Features section that highlights Aviatrix Platform features.
Chart Views
Additional information about your resources is available in the chart views sections.
The Egress section provides overview information about the protection status of your VPCs and VNets. The following two cards are displayed for Egress:
-
Egress Security Score: This score indicates how well your VPC/VNets are protected by Aviatrix PaaS. The Protect VPC/VNets button takes you to Security > Egress > Protected VPC/VNets, where there are options to onboard, monitor, and protect your VPCs and VNets.
-
Protected VPC/VNets: Shows a breakdown of Unprotected, Partially Protected, Protected, and Monitored VPC/VNets.
For more information about the egress charts, see Egress Security Overview.
In the Cloud Resources section is an inventory of resources across all clouds in your multicloud network that are discovered by Aviatrix PaaS. The cards show a breakdown of resources based on the cloud service provider (CSP). The following cards are displayed:
-
Cloud Accounts: Displays the badges of all CSPs that have been onboarded to Aviatrix PaaS. These accounts can have managed or unmanaged resources.
-
VPC/VNets: Shows the total number of VPCs and VNets discovered in your network by Aviatrix PaaS. The numbers of Aviatrix-managed VPCs and VNets are shown per cloud service provider (CSP).
The Unmanaged button displays a list of the names and associated CSPs for both managed and unmanaged VPCs and VNets. The list is ordered by unmanaged resources first.
-
VMs by Cloud: Includes a bar chart and a donut chart that show the distribution of virtual machines (VMs) per CSP.
You can hover over the donut chart to see a breakdown of the VMs by CSP.