- Overview
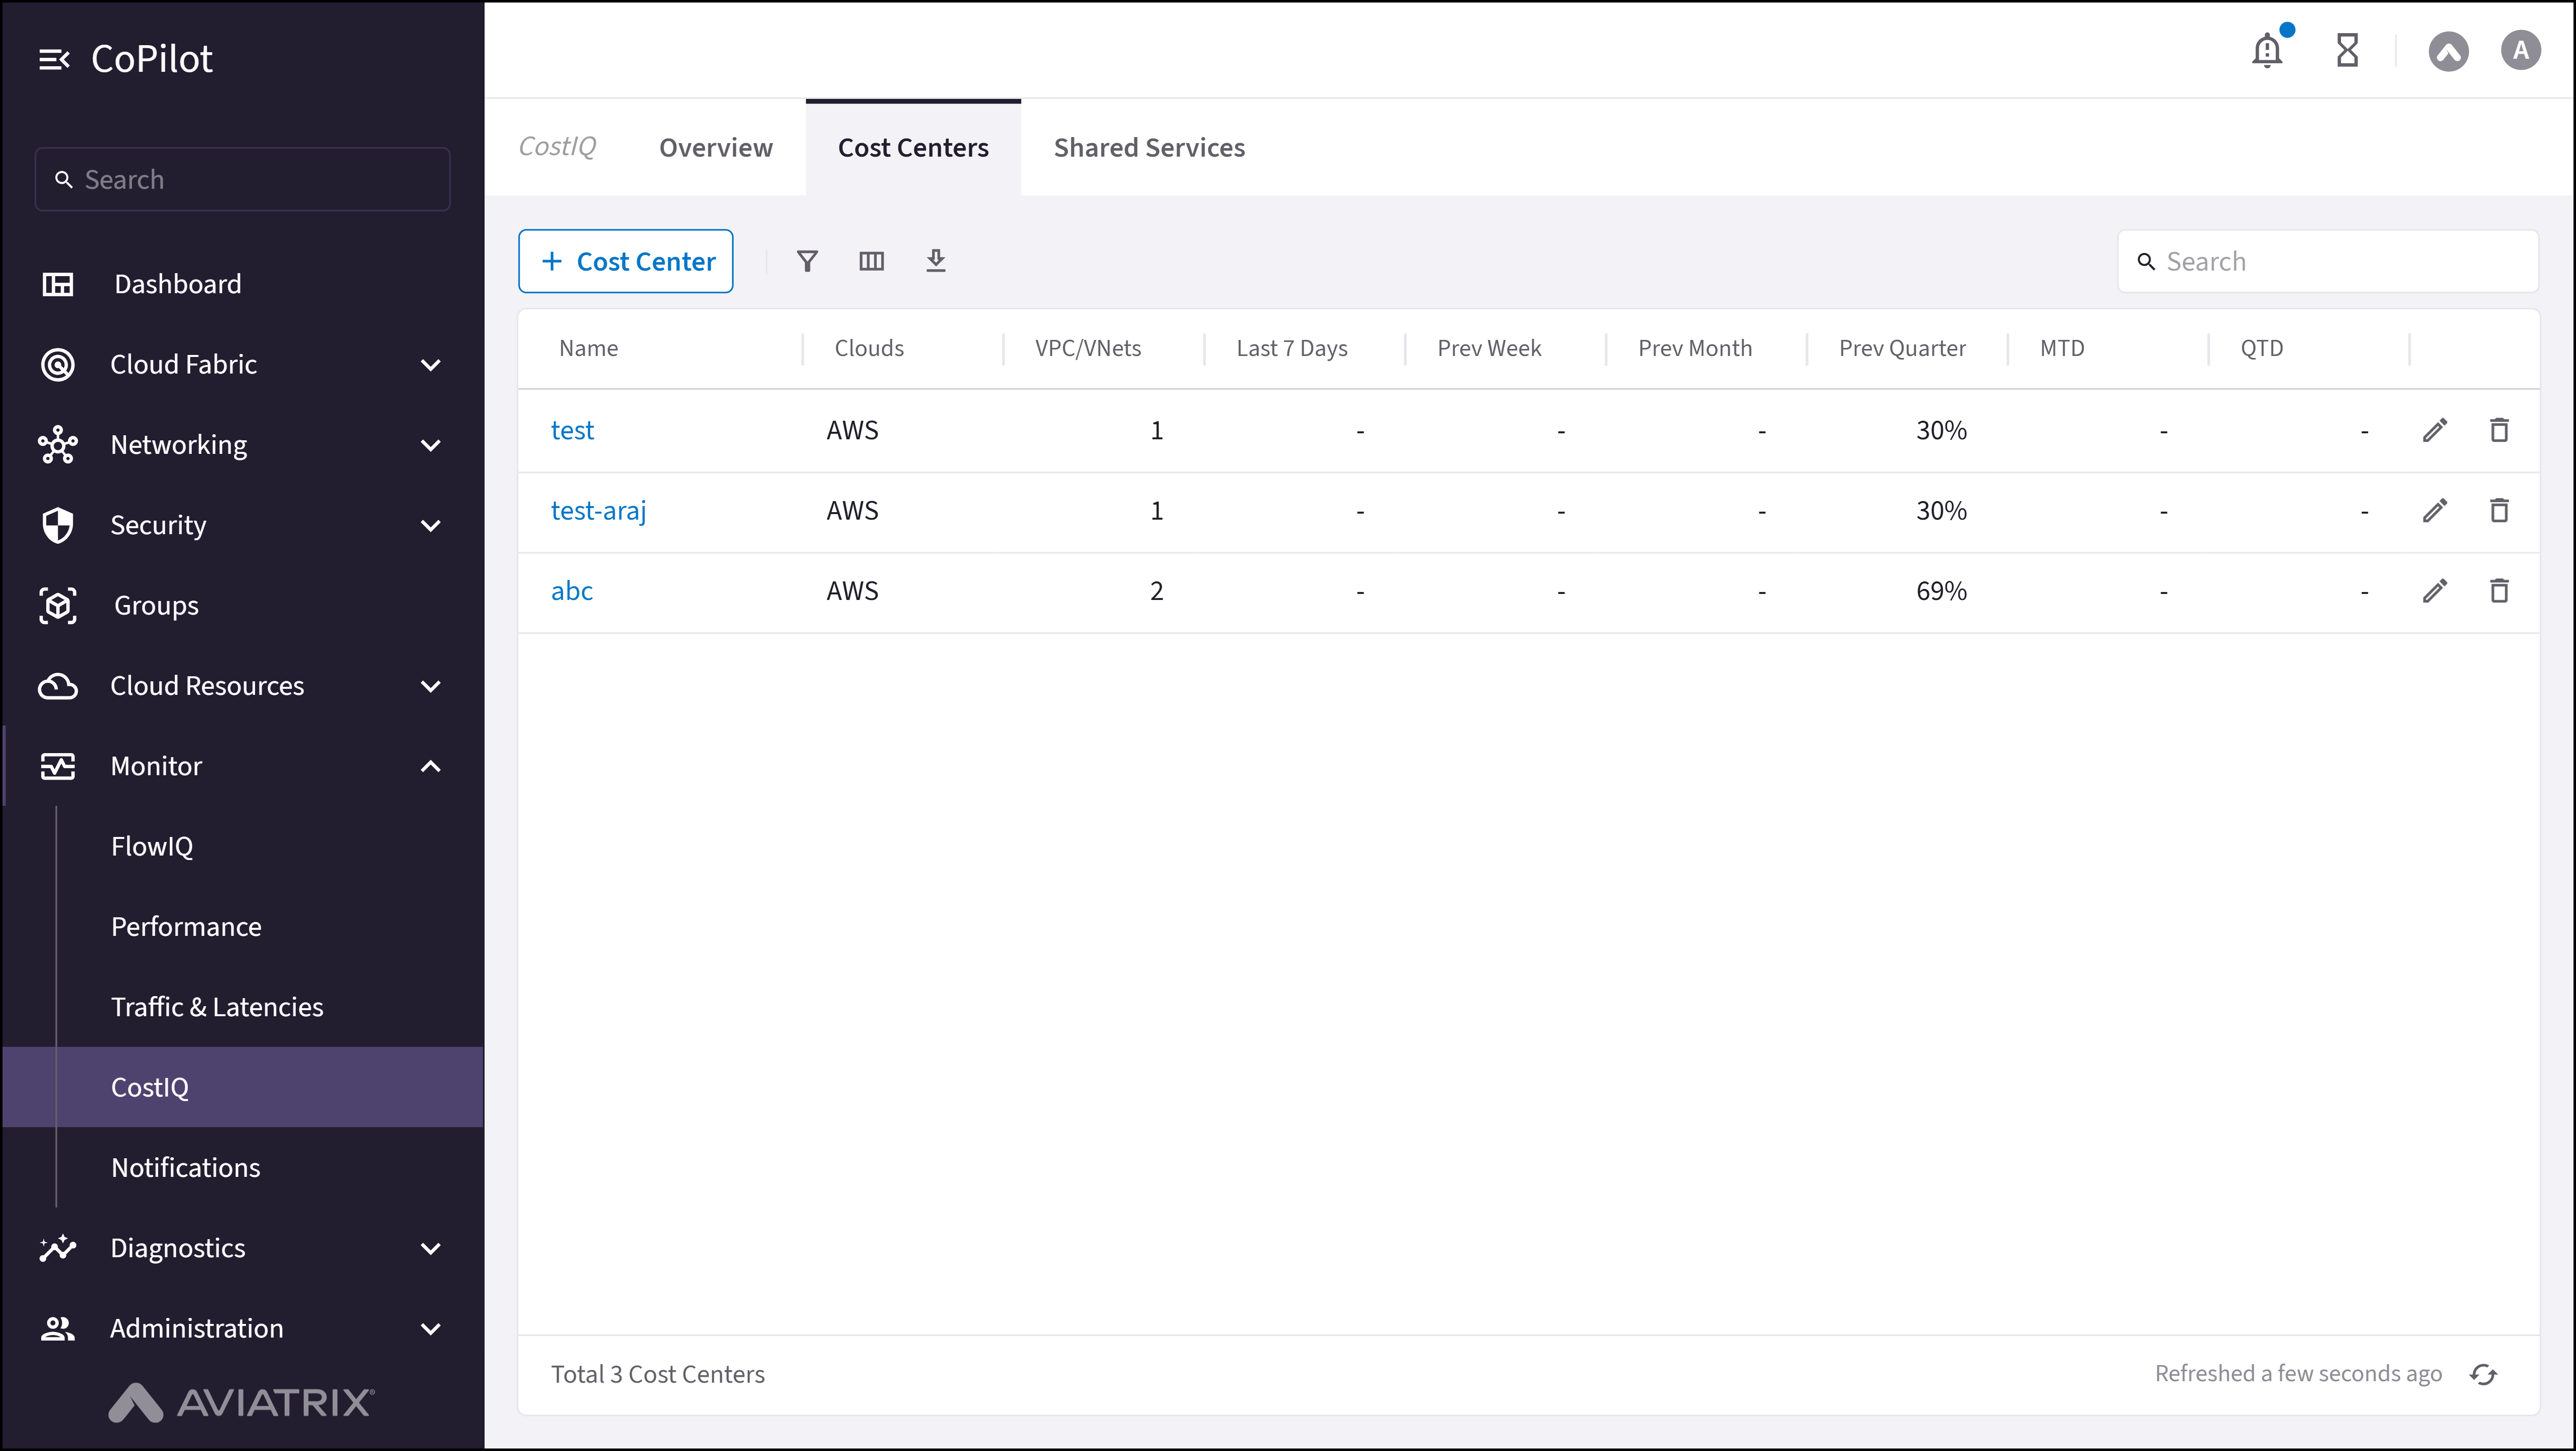
- Cost Centers
Purpose
The Overview page provides a consolidated view of cloud cost analytics, trends, and optimization opportunities across all accounts and regions.Elements
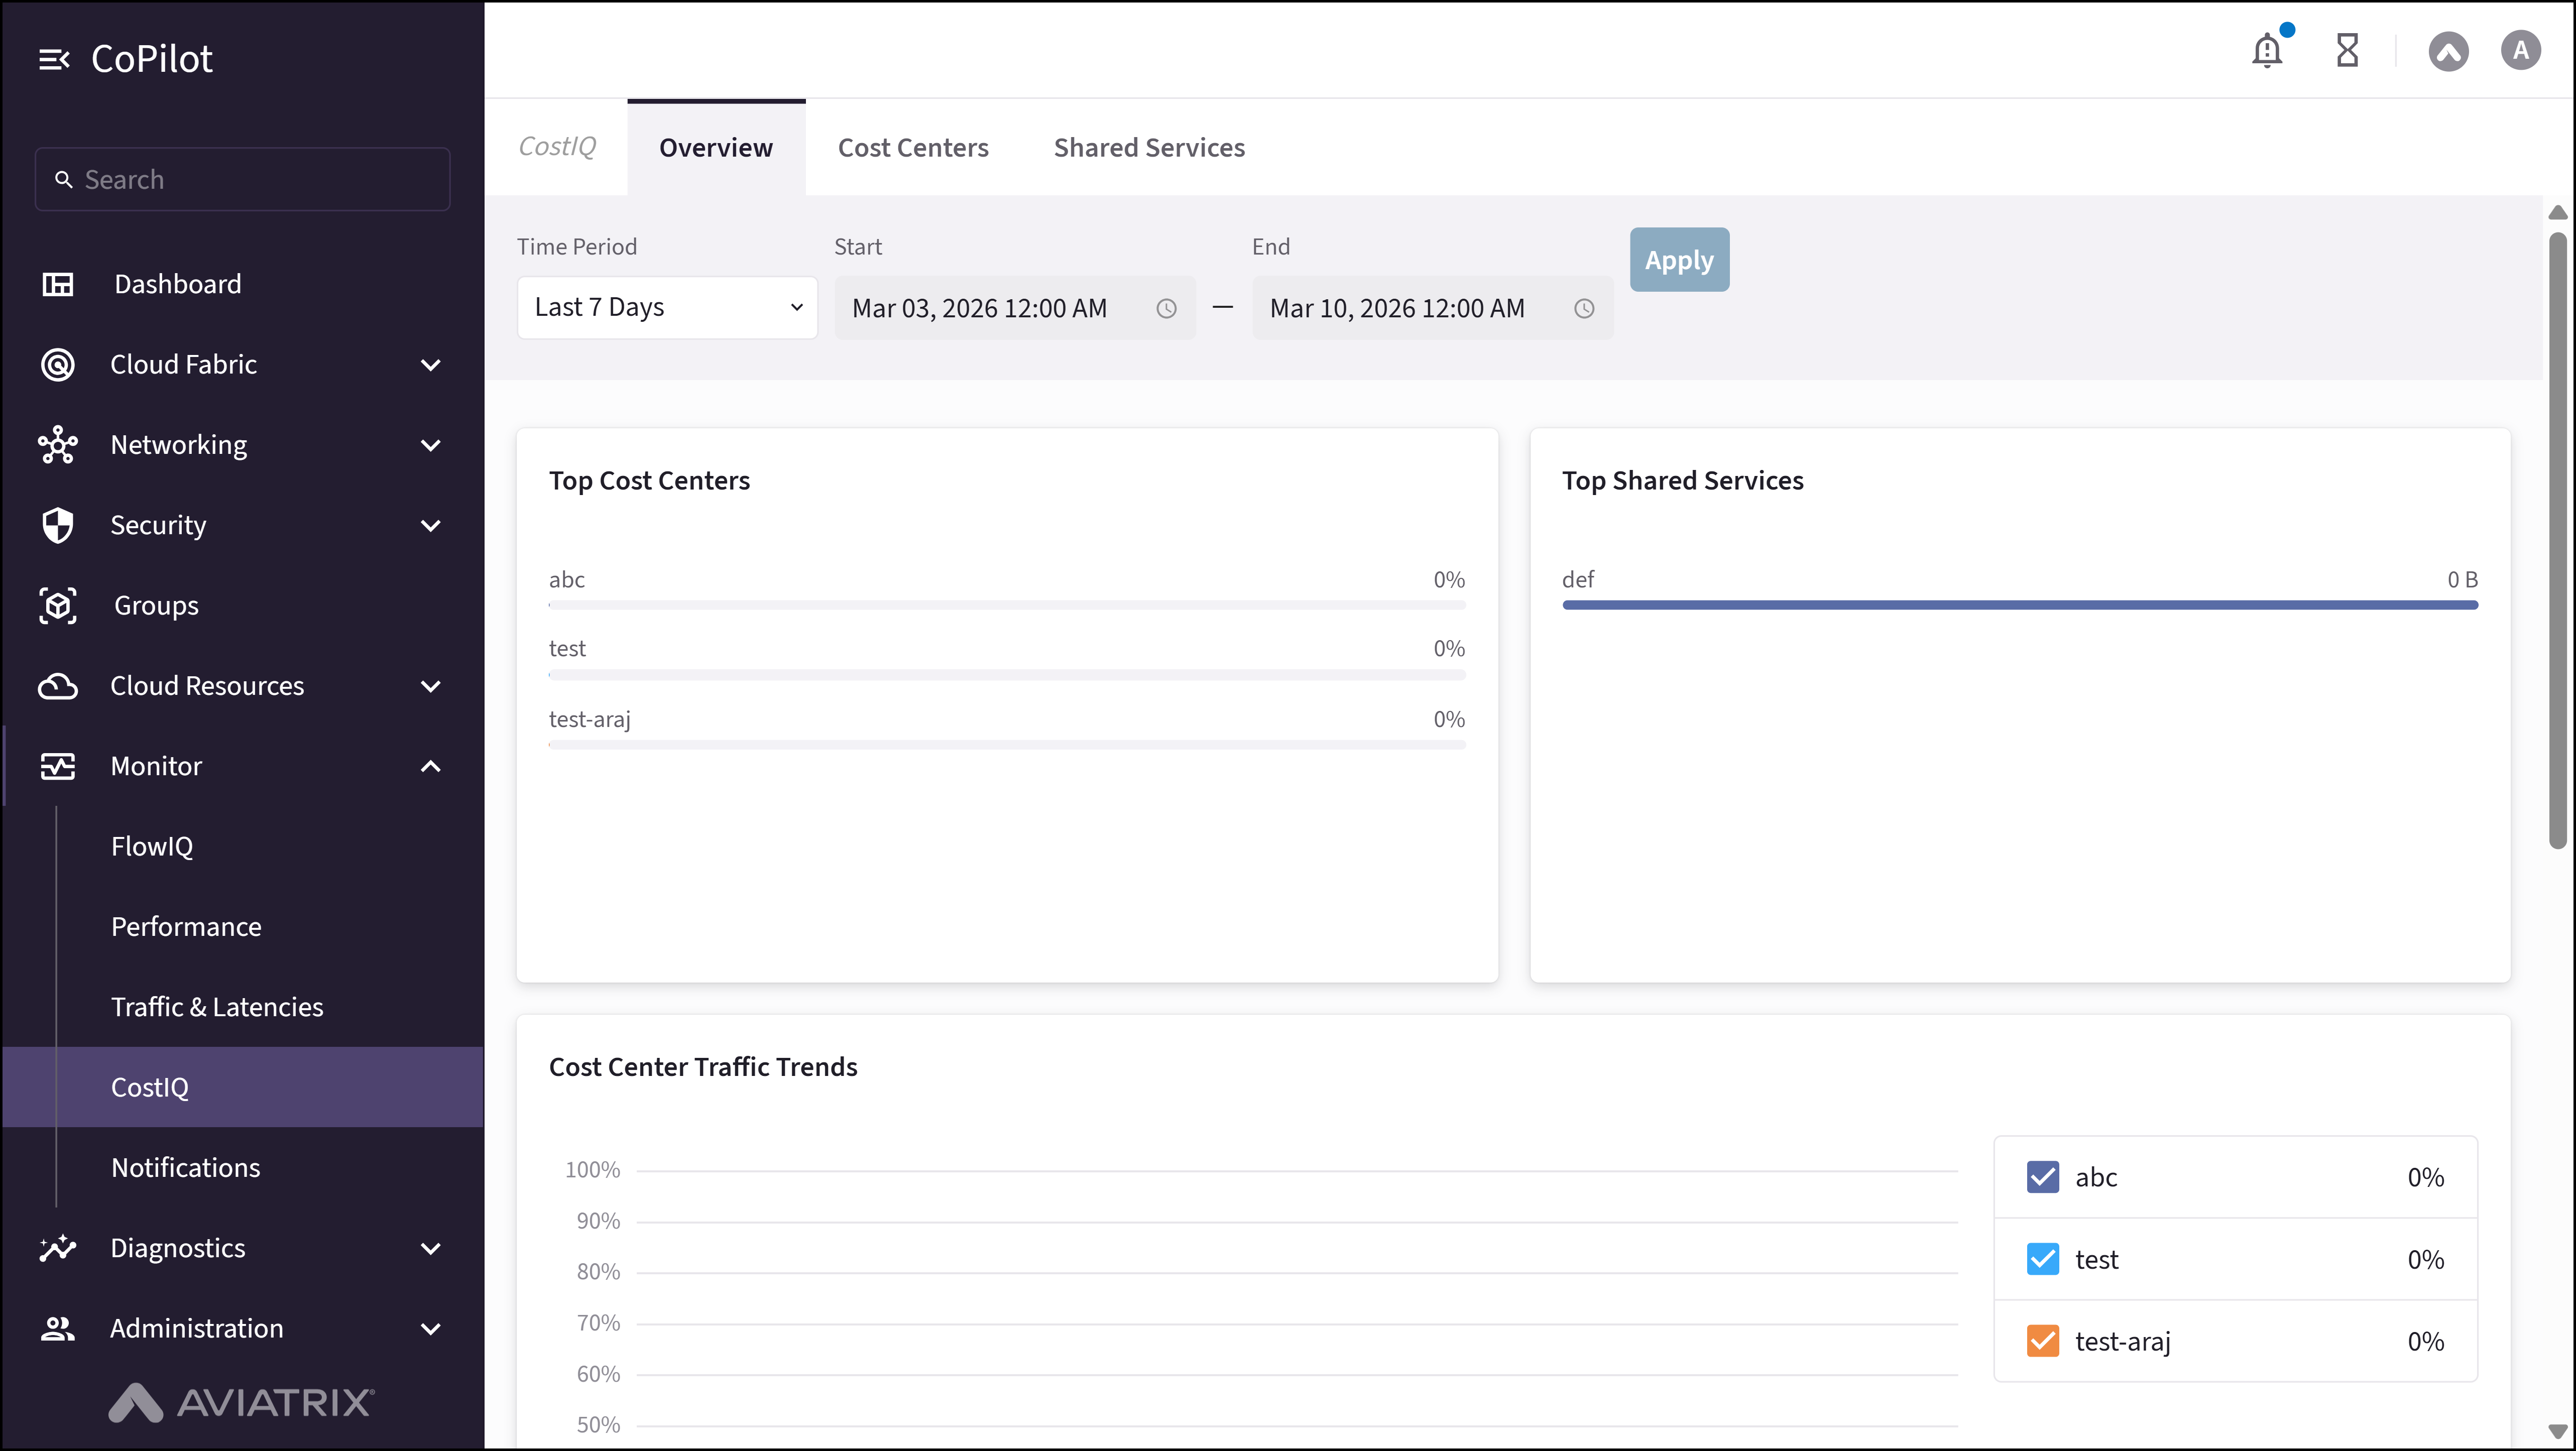
- Total Cloud Spend: Displays aggregate cost across all clouds.
- Cost Trend Graph: Visualizes cost trends over selected time periods.
- Filters:
- Time Range: Last 7 Days, Last 30 Days, Custom.
- Cloud Provider: AWS, Azure, GCP.
- Account or Subscription: Filter by account.
- Top Metrics:
- Highest Spending Accounts
- Services with Maximum Cost
- Regions with Highest Cost
Actions
View CostIQ Overview
View CostIQ Overview
To view cloud cost analytics and trends:
- Go to Monitor > CostIQ > Overview.
- The Overview page appears with Total Cloud Spend, Cost Trend Graph, and Top Metrics (Highest Spending Accounts, Services with Maximum Cost, Regions with Highest Cost).
- Optionally, use Time Range, Cloud Provider, or Account or Subscription filters to narrow the view.
Parameter Details
| CoPilot Parameter Name | Description |
|---|---|
| Total Cloud Spend | Displays total cost across all clouds. |
| Cost Trend Graph | Shows cost trends over selected time range. |
| Time Range Selector | Dropdown to select time range for cost analysis. |
| Cloud Provider Filter | Filter data by cloud provider. |
| Account Filter | Filter data by account or subscription. |
| Top Spending Accounts | Lists accounts with highest cloud spend. |