Purpose
The Dashboard page shows real-time—high-level view of network health, resource inventory, connectivity status, and security posture across all onboarded cloud environmentsElements
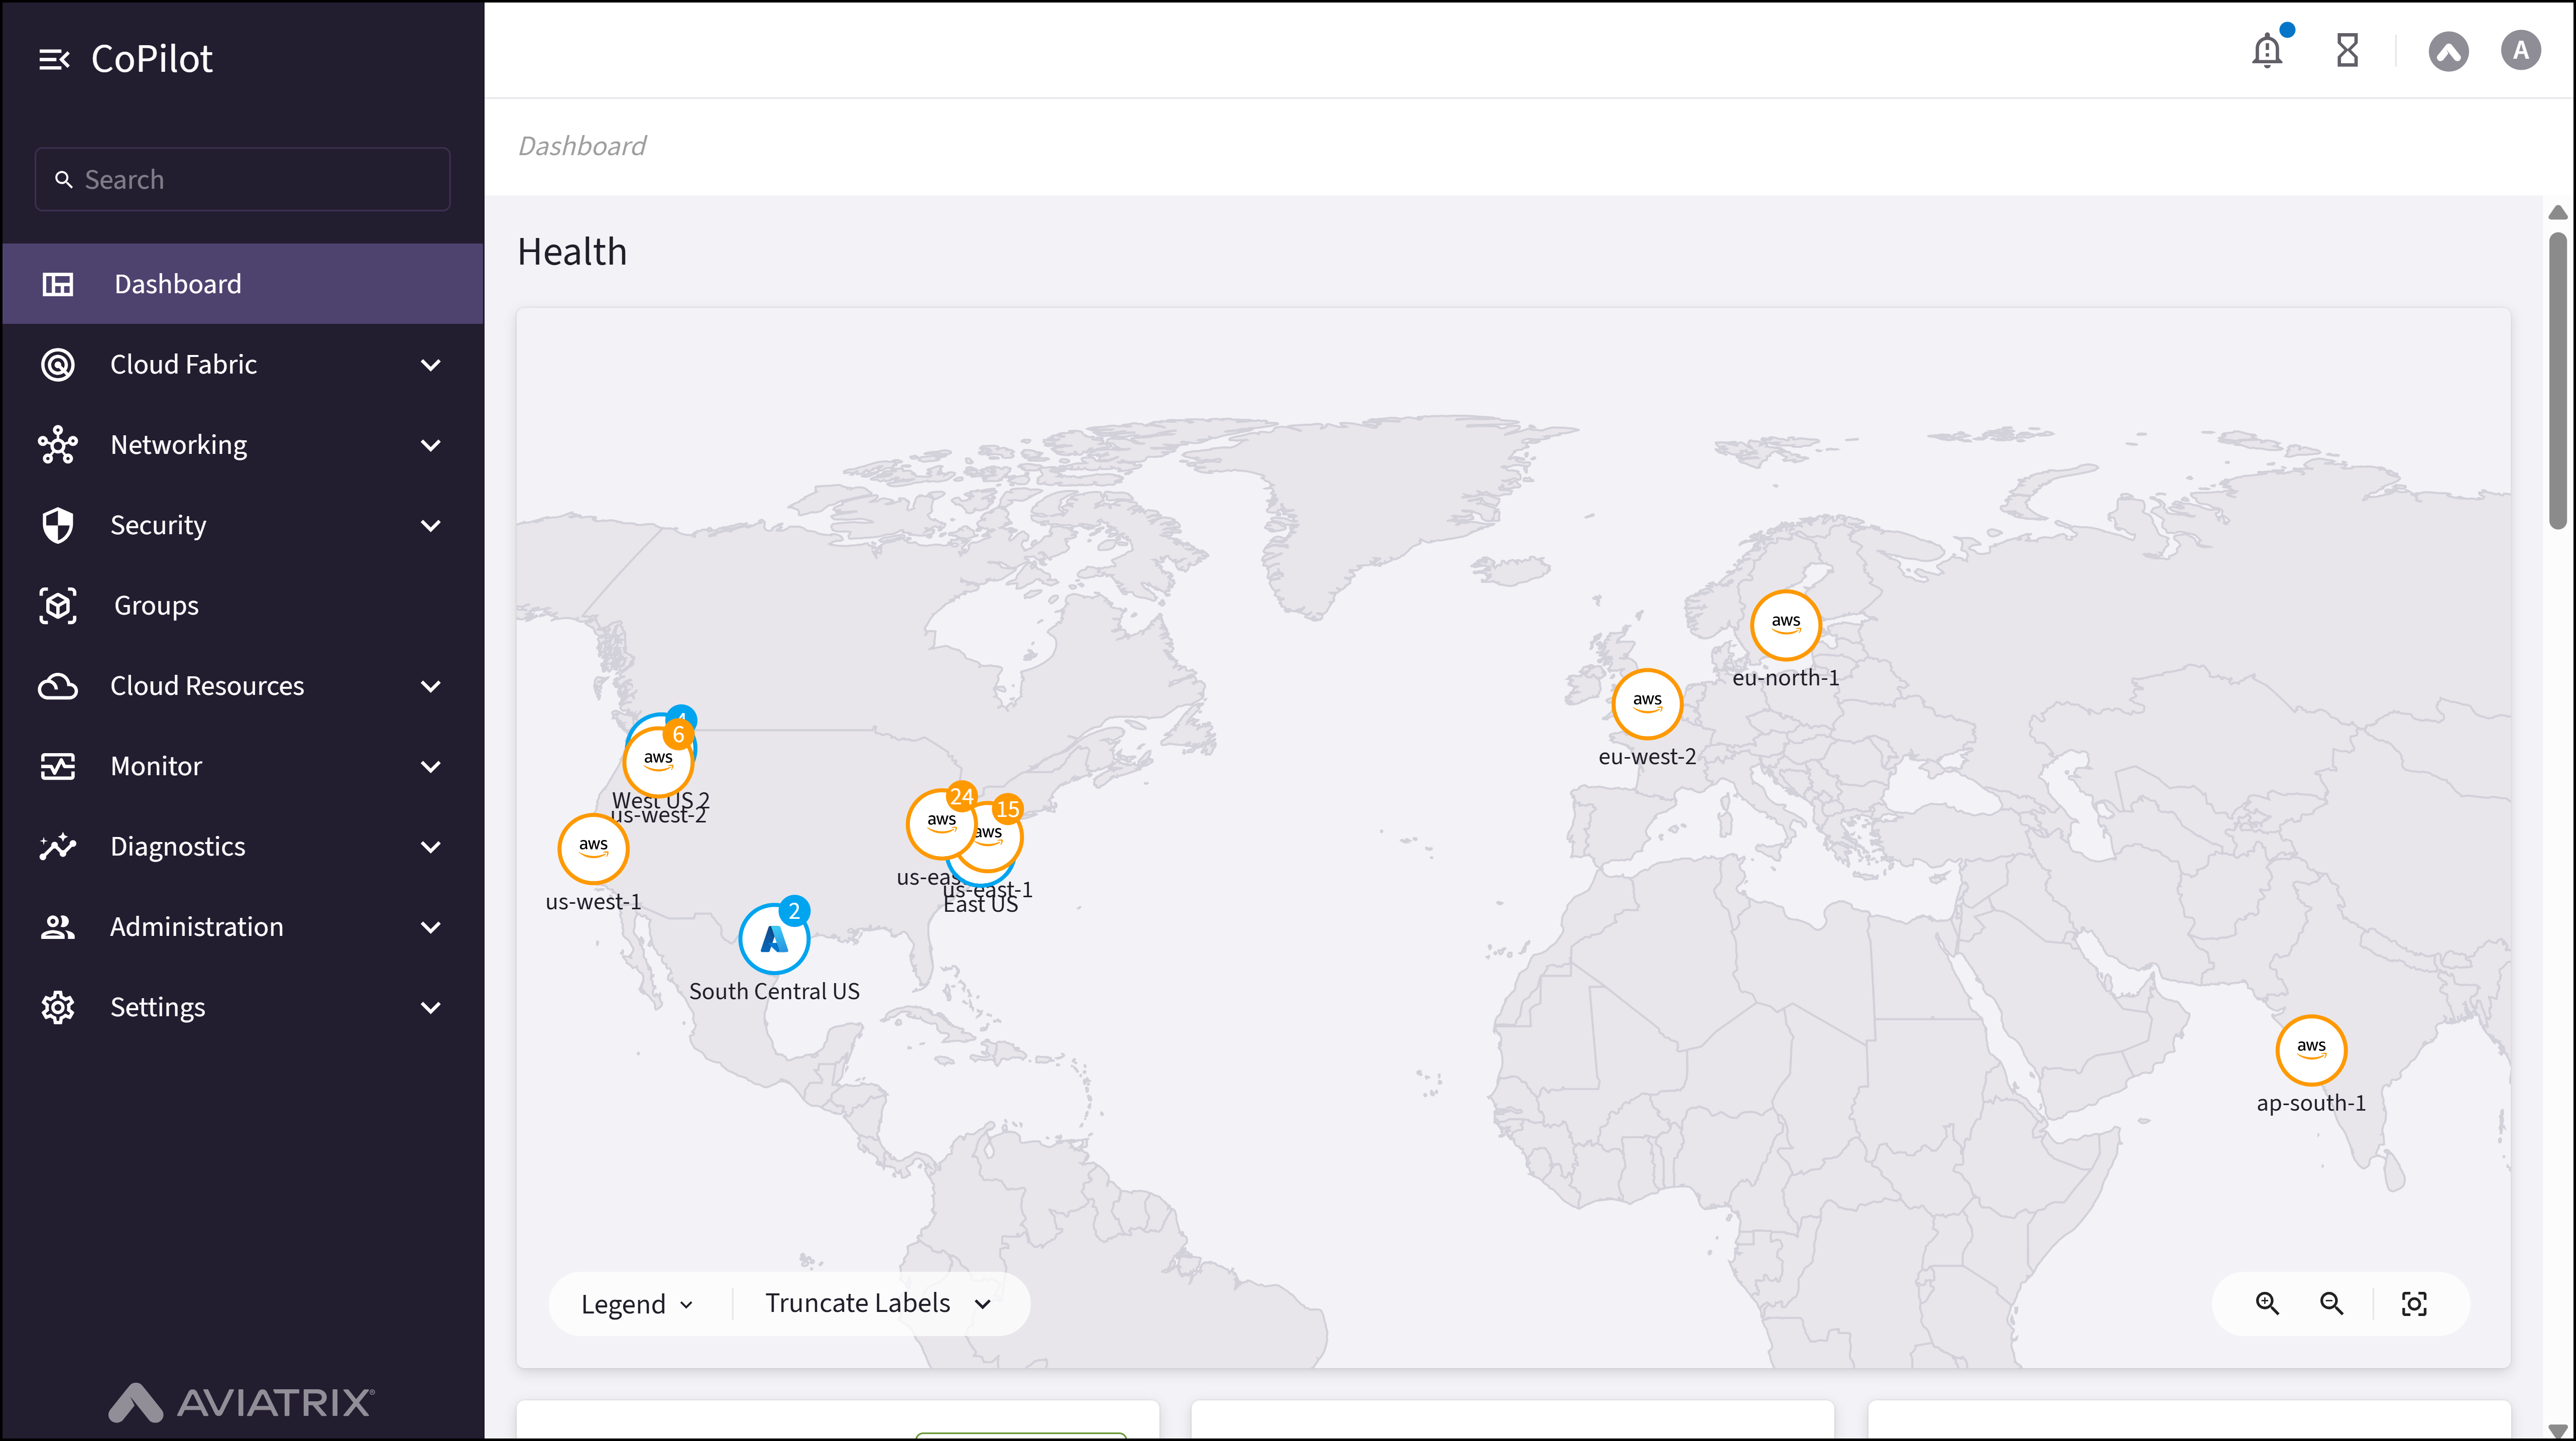
- Dashboard topology canvas: Interactive map that shows the physical views of your Multi-Cloud Network Architecture (MCNA)
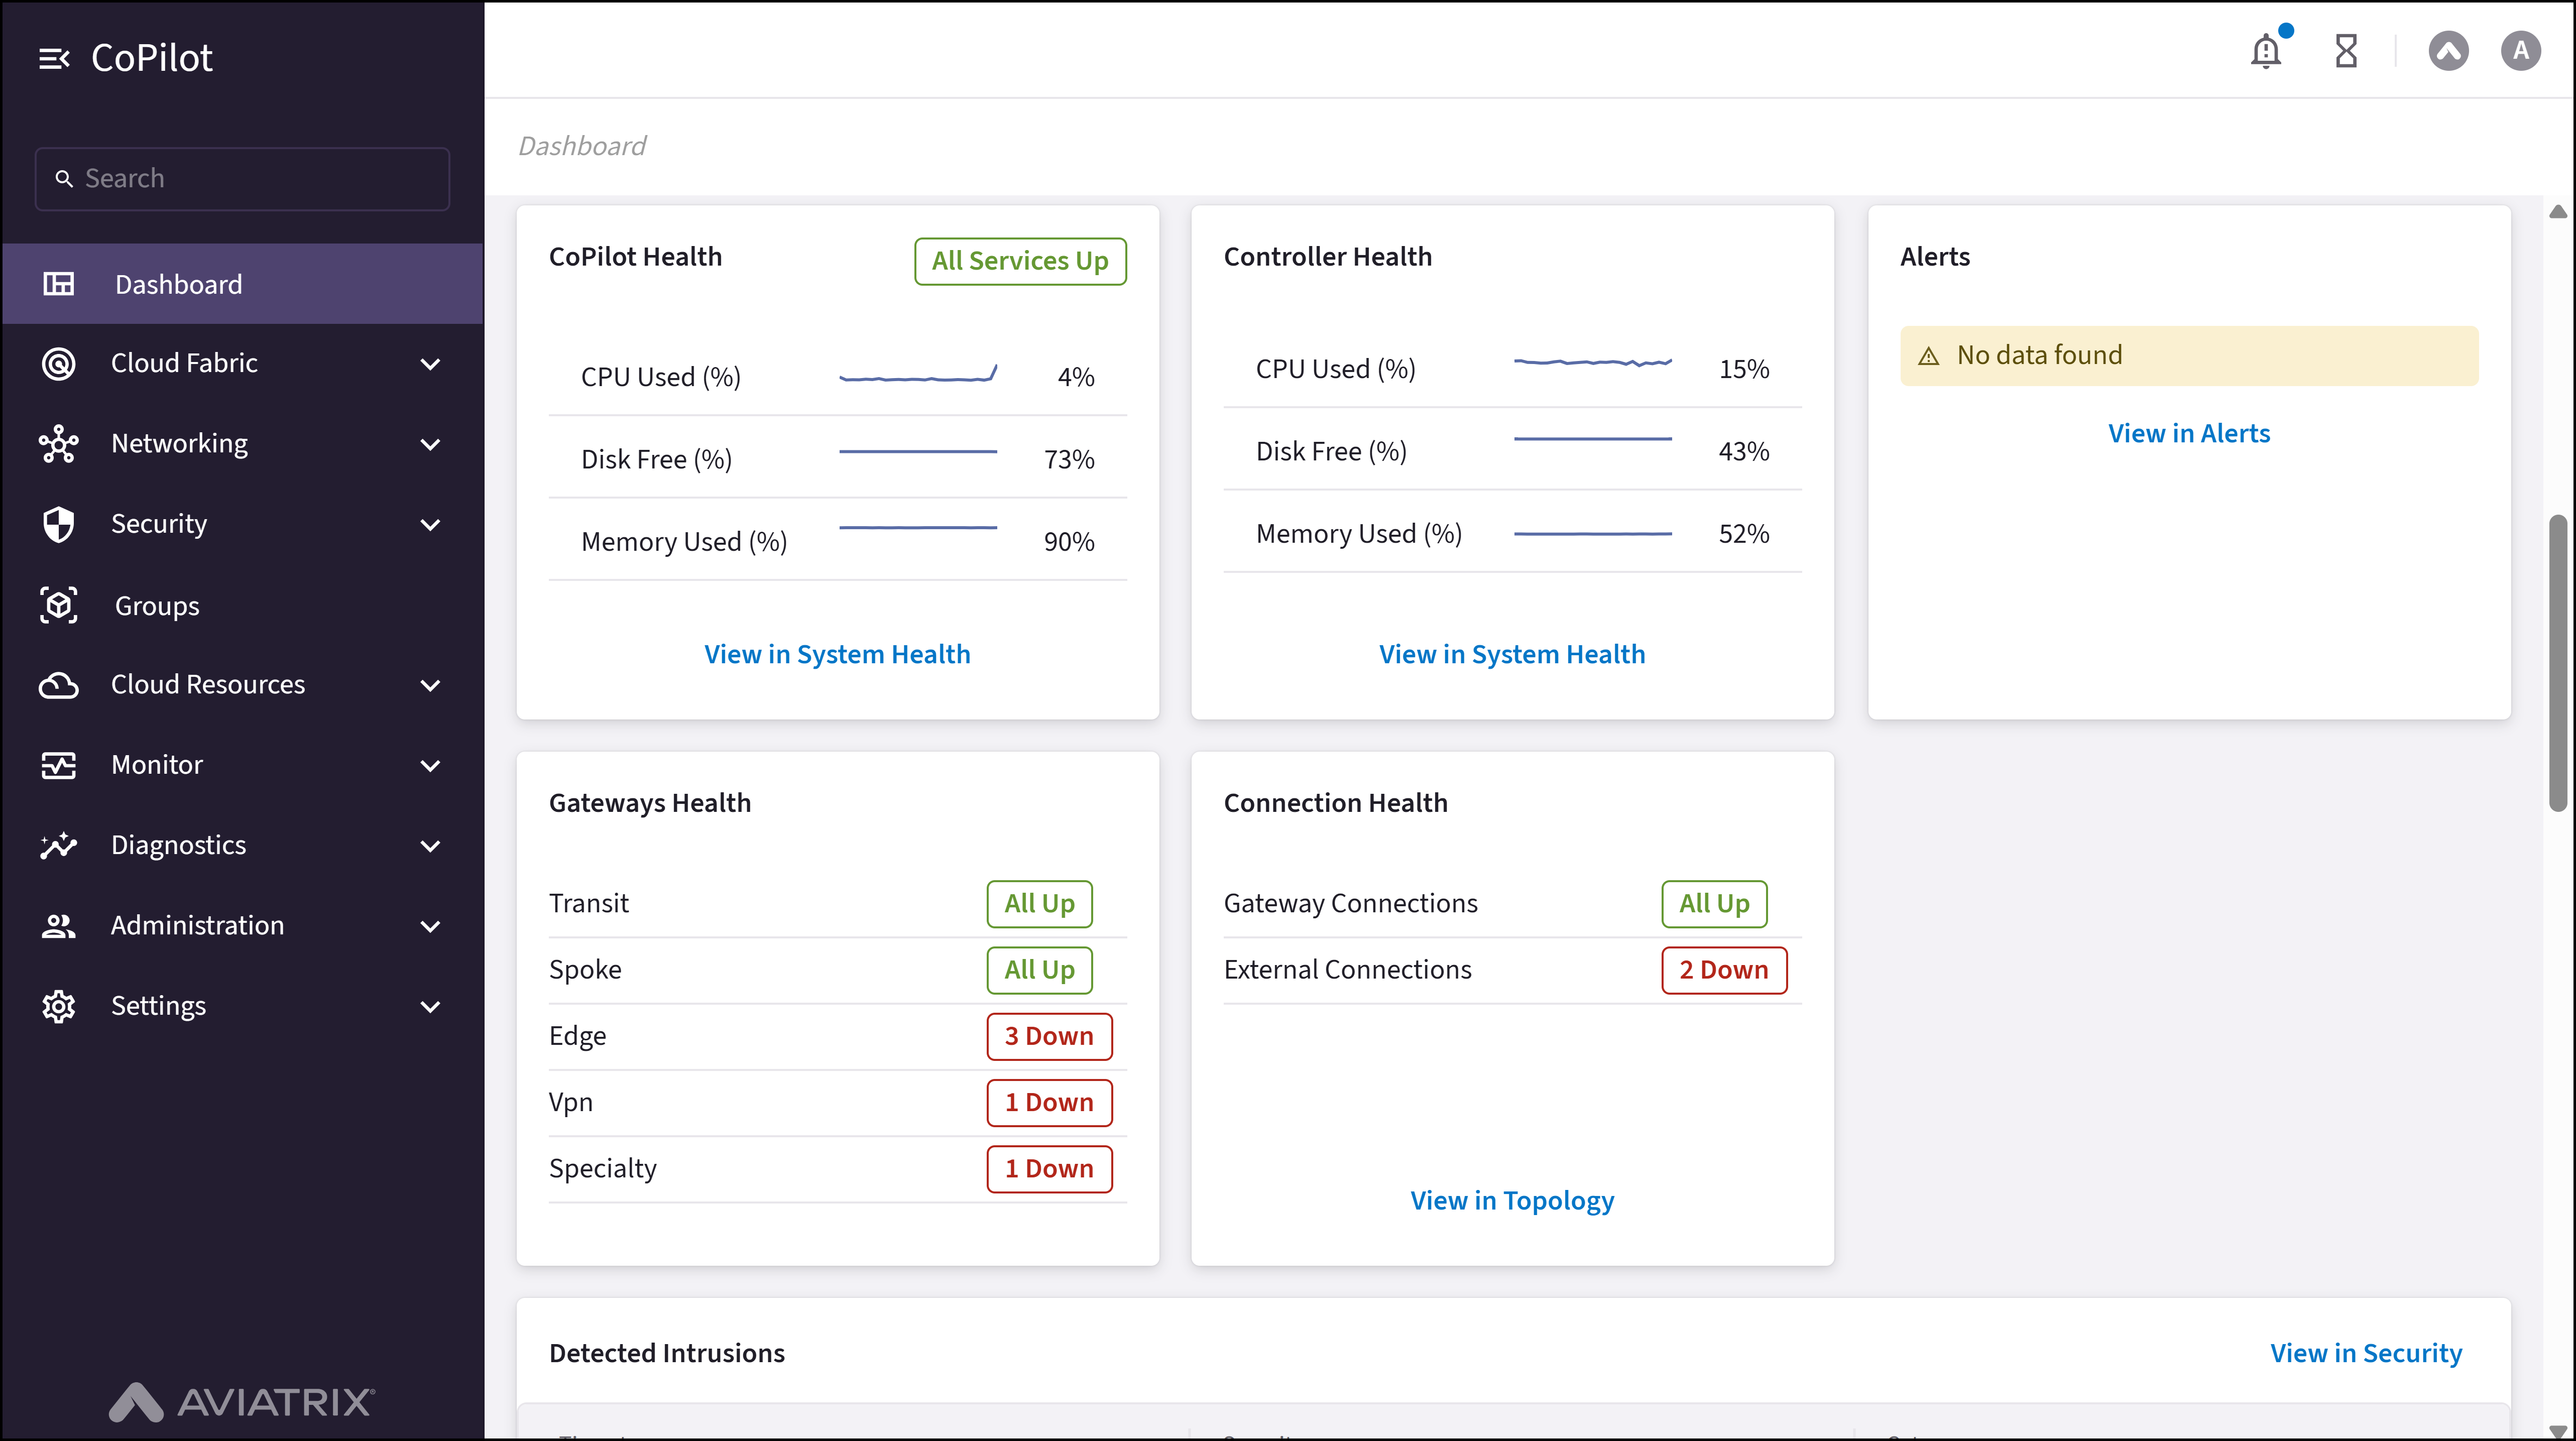
- Health cards: Shows real-time health status of the following:
- CoPilot Health
- Controller Health
- Alerts ( Shows recent alerts)
- Gateways Health
- Connections Health
- Detected Intrusions (Shows detected threats and intrusions)
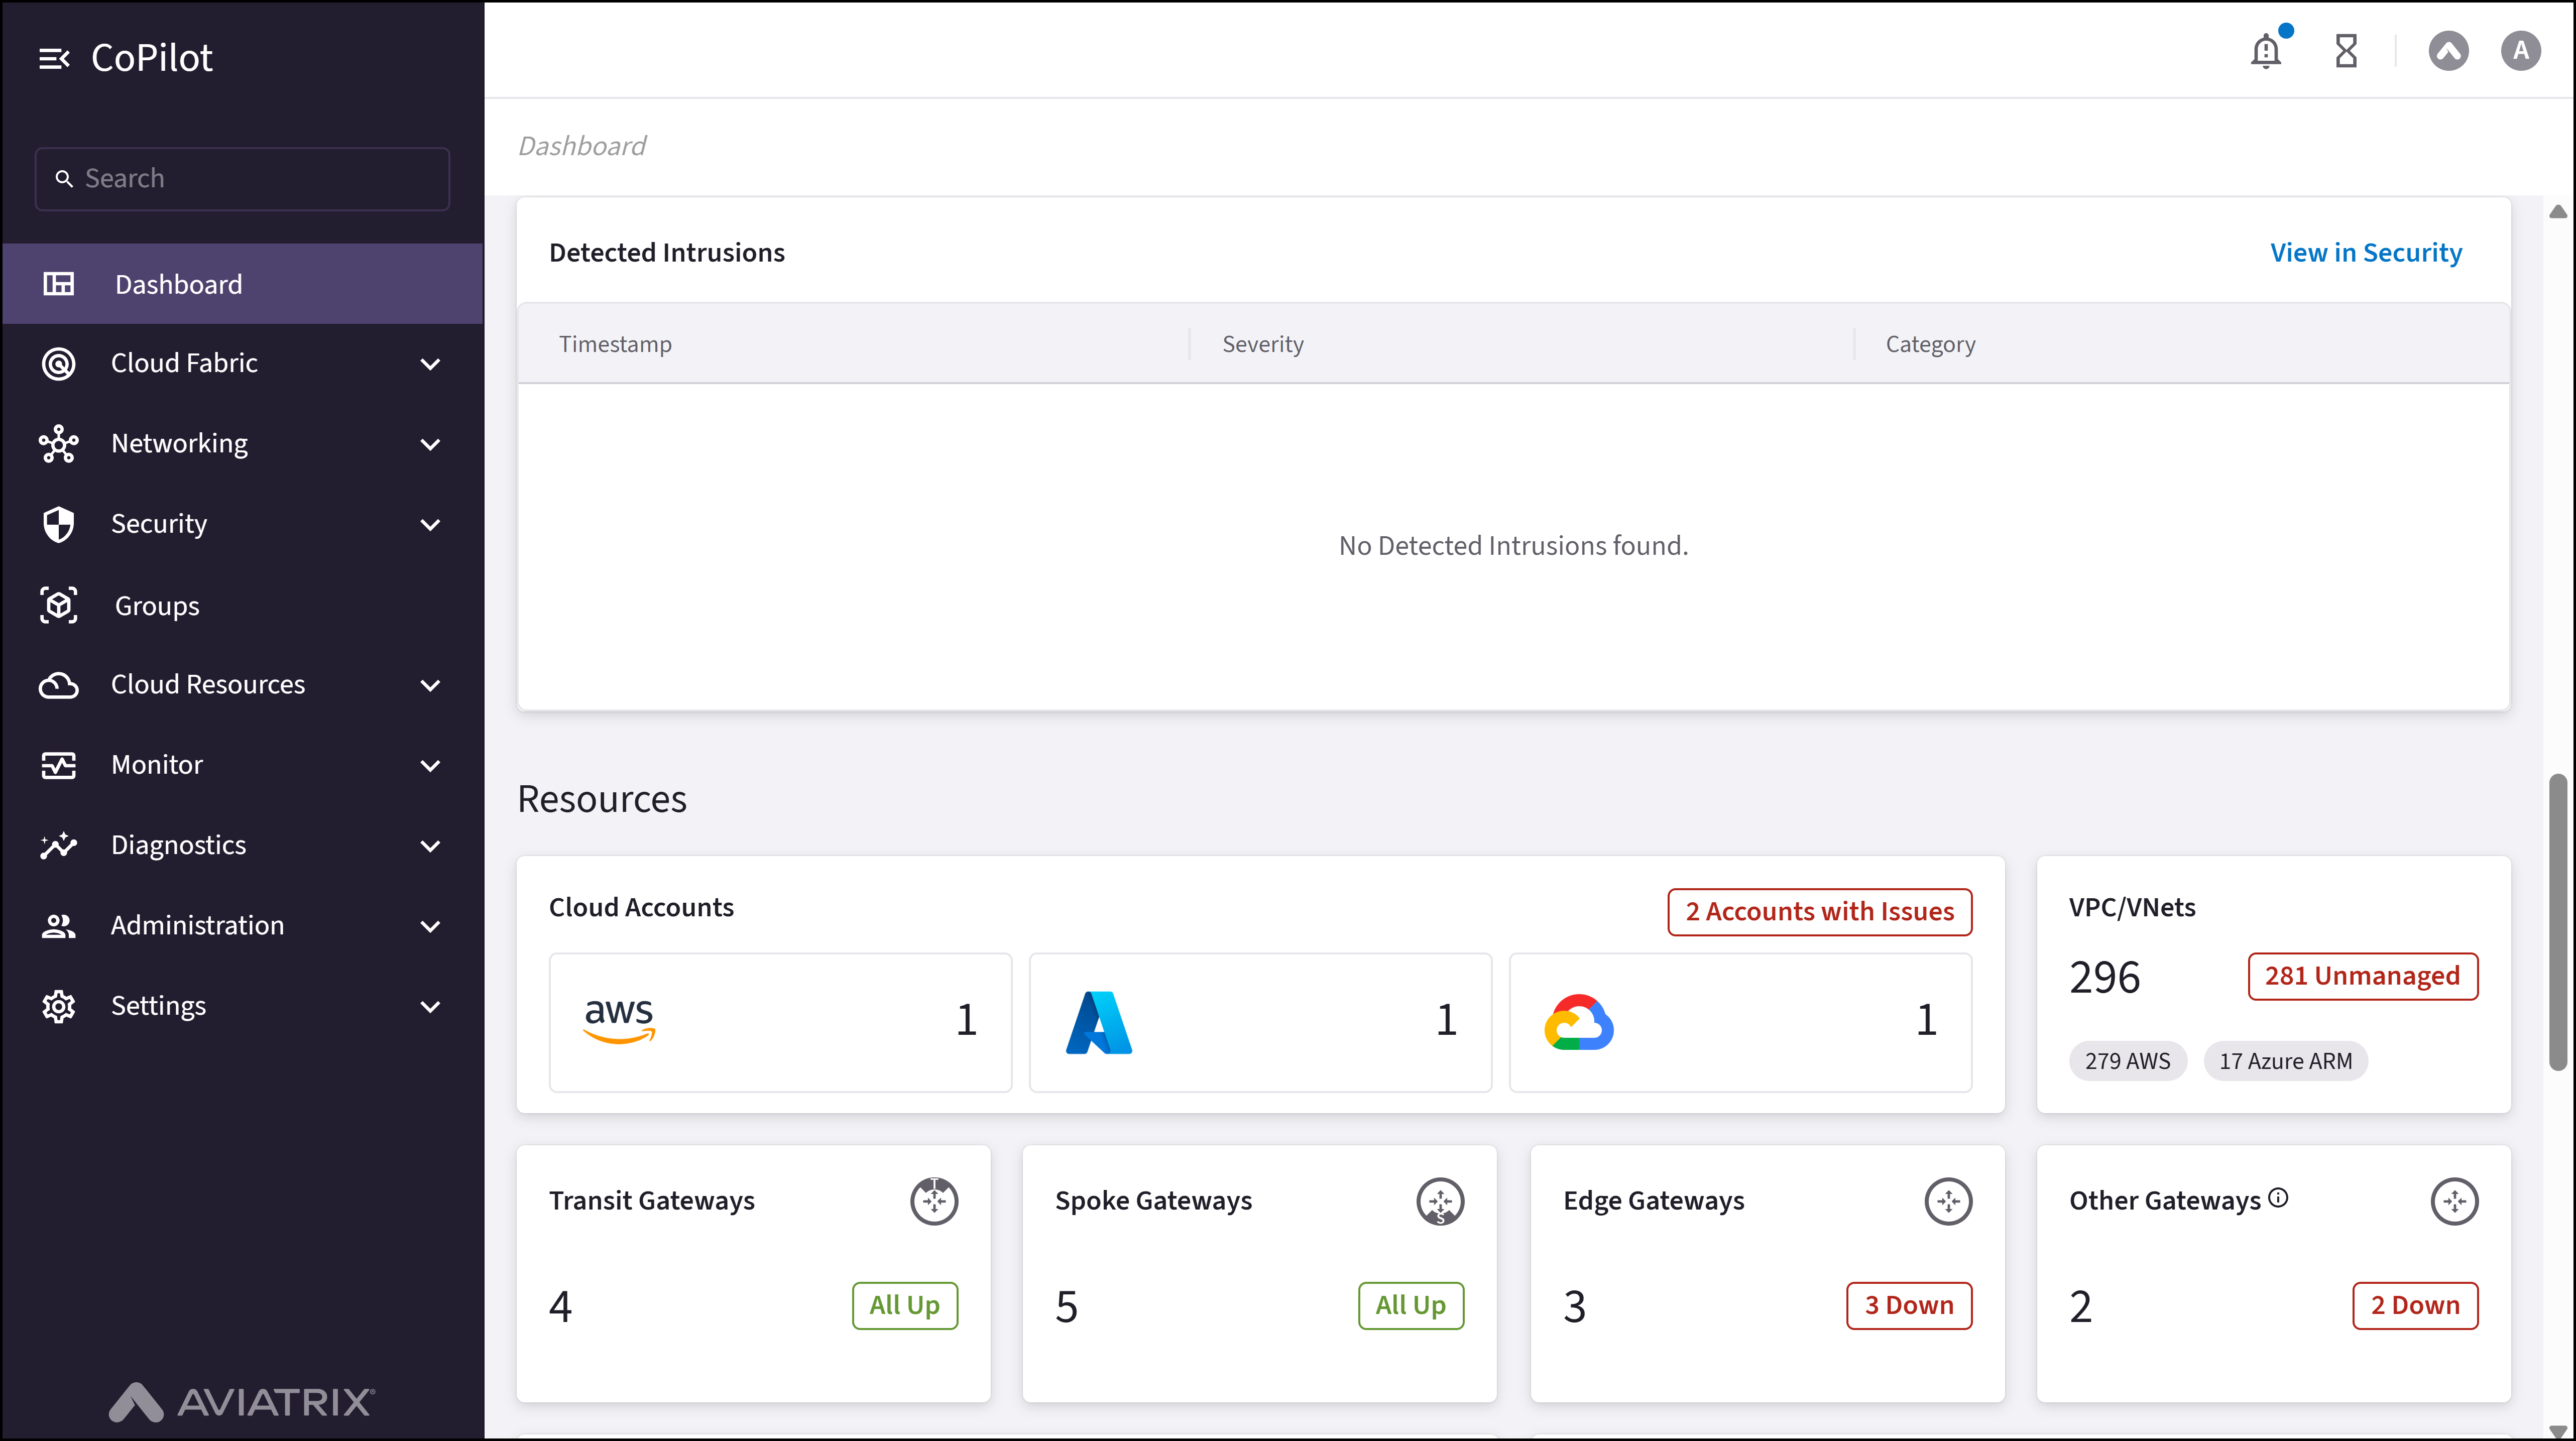
- Resource Distribution charts: Shows count and statuses of the following resources:
- Cloud Accounts
- VPC/VNets
- Transit Gateways
- Spoke Gateways
- Edge Gateways
- Other Gateways
- VPN User Count
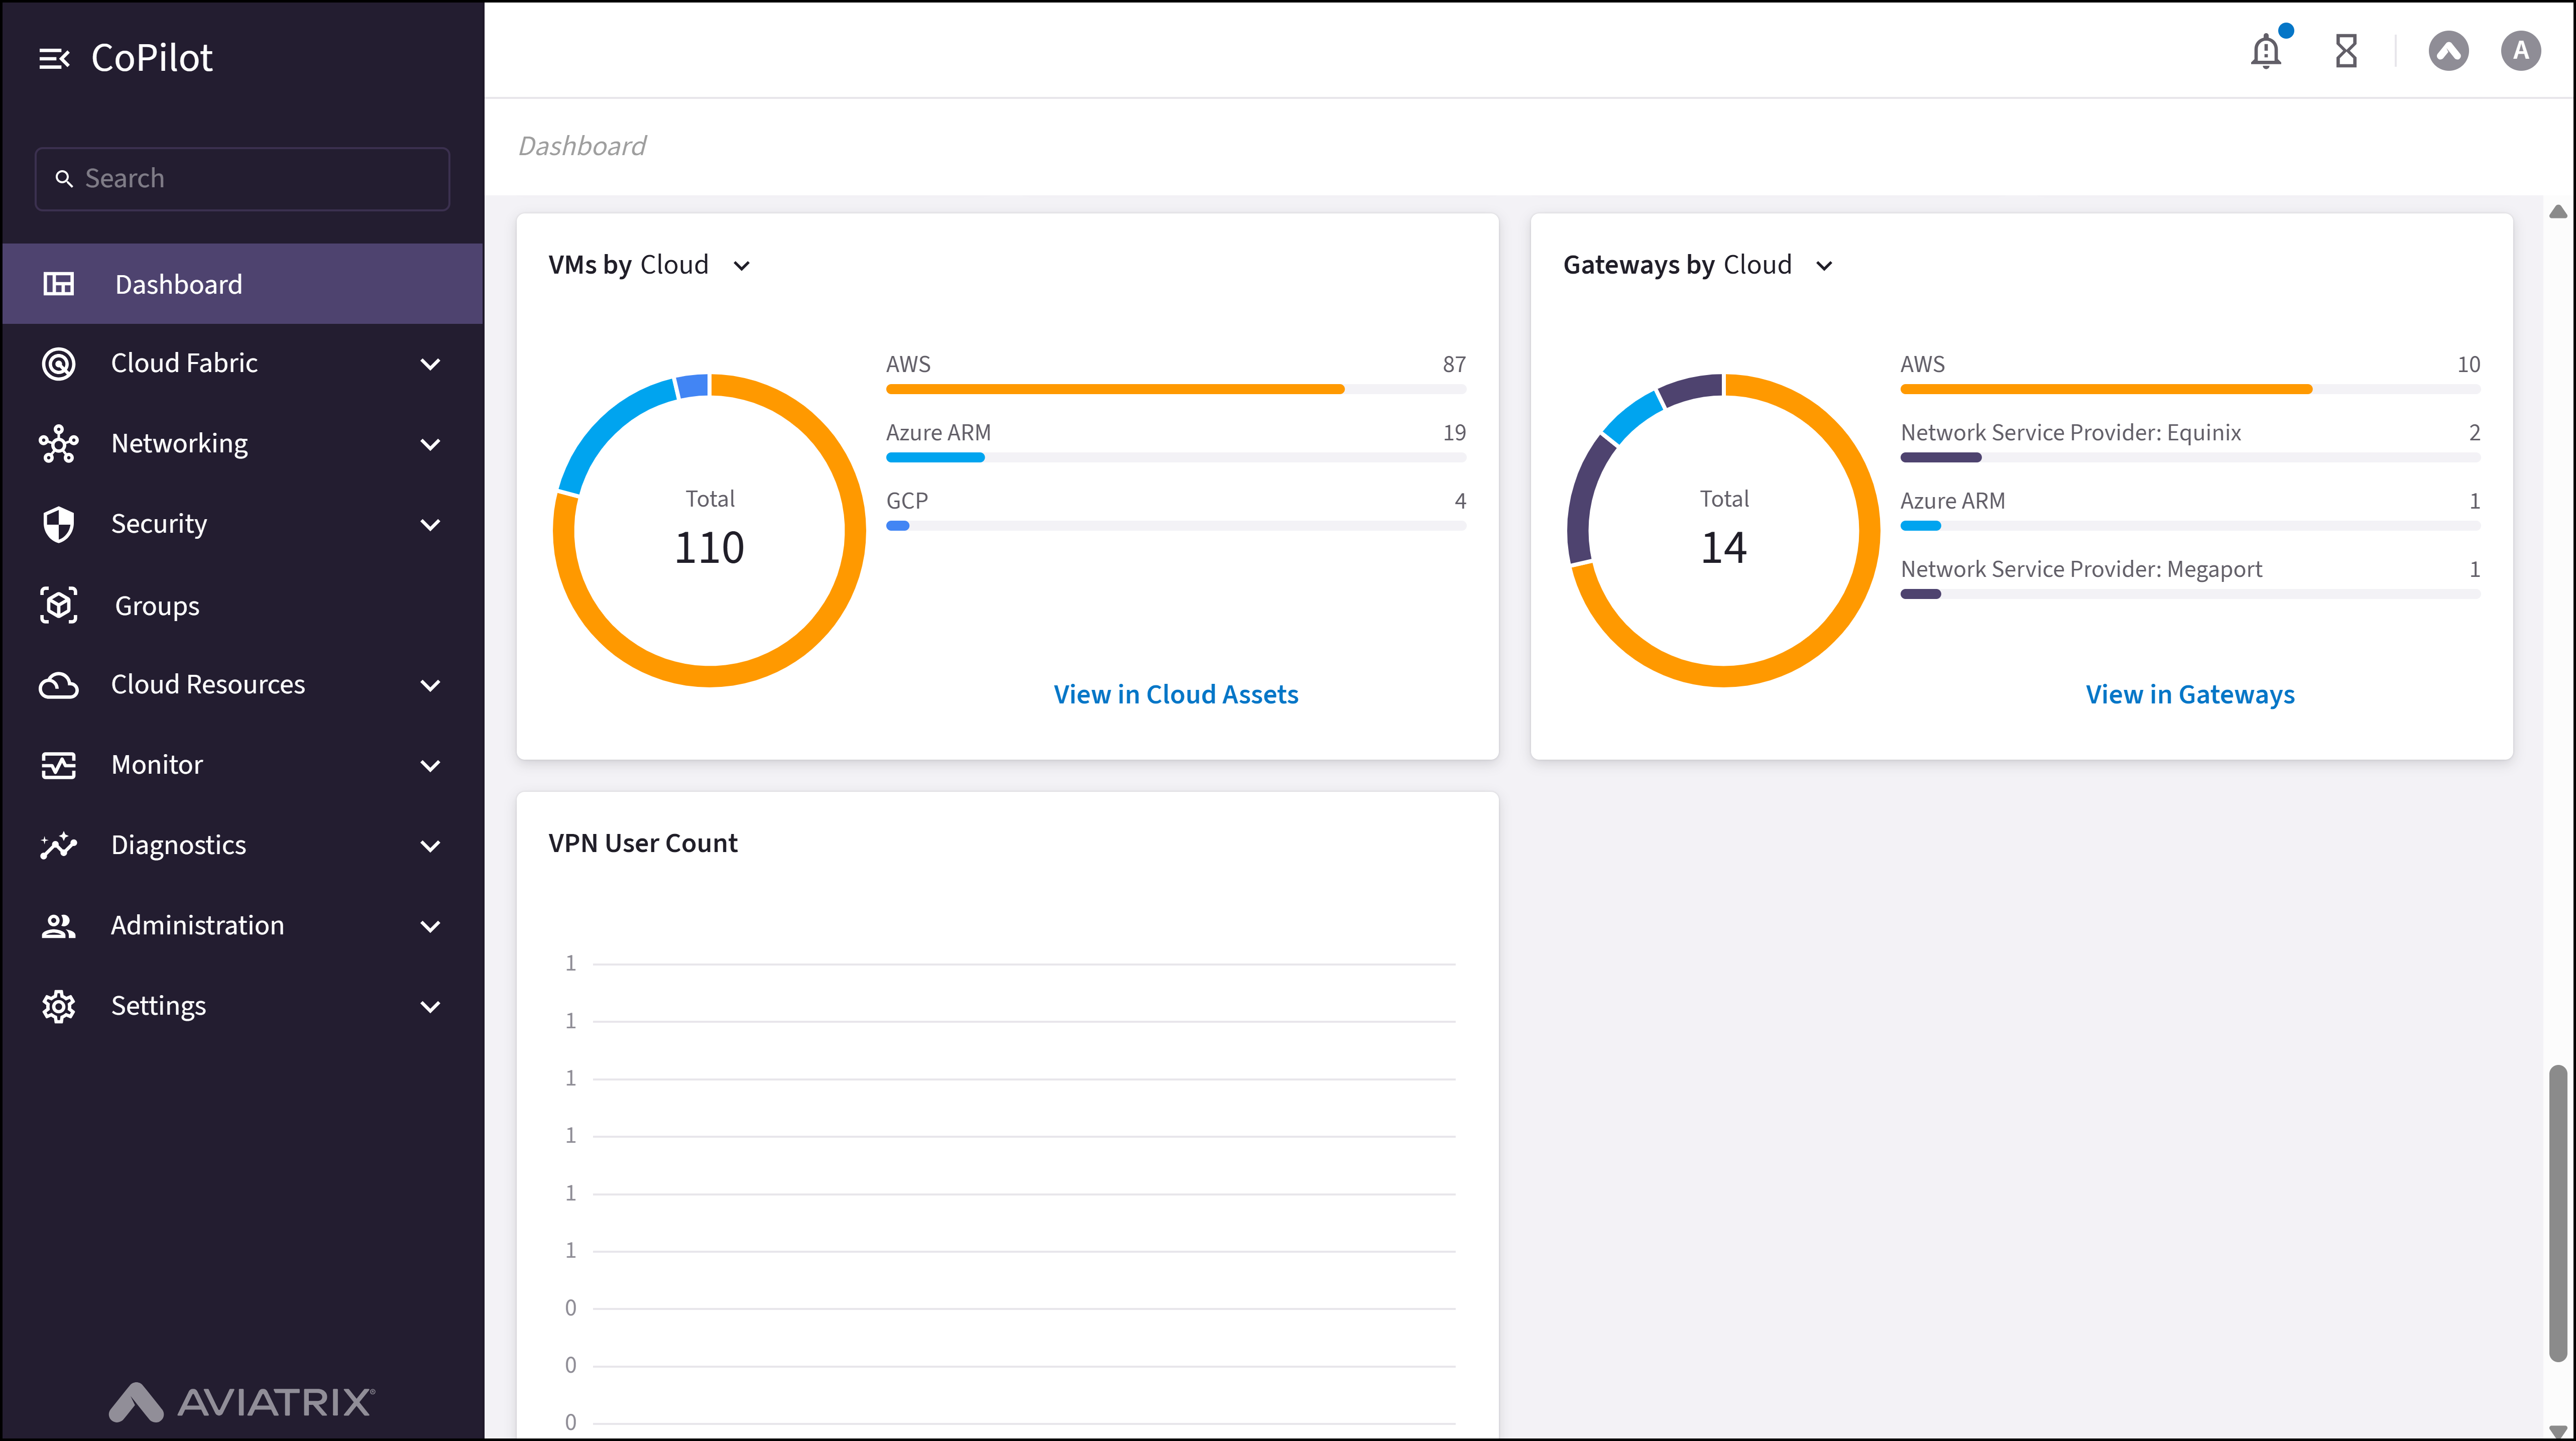
- Pie charts and Graphs: Shows distribution of the following resources:
- Visualizes the VM count/statuses by:
- Cloud
- Type
- Status
- Visualizes the gateways count/statuses by:
- Cloud
- Type
- Size
- Region
- VPN User Count over time
- Visualizes the VM count/statuses by:
Actions
Viewing Health Dashboard
Viewing Health Dashboard
To view the Health Dashboard, in Aviatrix CoPilot, click Dashboard. The Dashboard page appears with the Aviatrix Copilot and Controller health status.The following Parameter Details table shows the Dashboard parameters to understand the health status of the CoPilot and Controller.
Parameter Details
| CoPilot Parameter Name | Description |
|---|---|
| Health | |
| Geographic map | The geographic map shows Aviatrix-managed VPC/VNets, threats, and blocked countries. |
| CoPilot Health | Shows the health status of the CoPilot. |
| Controller Health | Shows the health status of the Controller. |
| Alerts | Shows the recent alerts. |
| Gateways Health | Shows the health status of the gateways. |
| Connections Health | Shows the health status of the connections. |
| Detected Intrusions | Shows the detected threats and intrusions. |
Viewing Resource Dashboard
Viewing Resource Dashboard
To view the Resource Dashboard, in Aviatrix CoPilot, click Dashboard. Scroll to the Resources section. The Resources section appears with the the resource distribution charts.
Parameter Details
| CoPilot Parameter Name | Description |
|---|---|
| Cloud Accounts | |
| Cloud Accounts | Shows the total number of cloud accounts added to the platform. |
| Number of Accounts with issue | Shows the number of cloud accounts with any issue. |
| VPCs or VNets | |
| VPCs or VNets | Shows the total number of VPCs or VNets in the cloud. |
| Unmanaged VPC Count | Shows the number of unmanaged VPCs or VNets. |
| Transit Gateways | |
| Transit Gateways | Shows the total number of Transit Gateways and their status. |
| Spoke Gateways | |
| Spoke Gateways | Shows the total number of Spoke Gateways and their status. |
| Edge Gateways | |
| Edge Gateways | Shows the total number of Edge Gateways and their status. |
| Other Gateways | |
| Other Gateways | Shows the total number of other gateways and their status. |
| VMs | |
| VMs by Cloud | Shows the number of VMs grouped by cloud provider. |
| VMs by Type | Shows the number of VMs grouped by instance type. |
| VMs by Status | Shows the number of VMs grouped by running status. |
| Gateways | |
| Gateways by Cloud | Shows the number of gateways grouped by cloud provider. |
| Gateways by Type | Shows the number of gateways grouped by type such as Transit, Spoke, and Edge. |
| Gateways by Size | Shows the number of gateways grouped by instance size. |
| Gateways by Region | Shows the number of gateways grouped by cloud region. |
| VPN User Count | |
| VPN User Count | Shows the total number of VPN users over time. |