- Intelligent Cloud Analytics
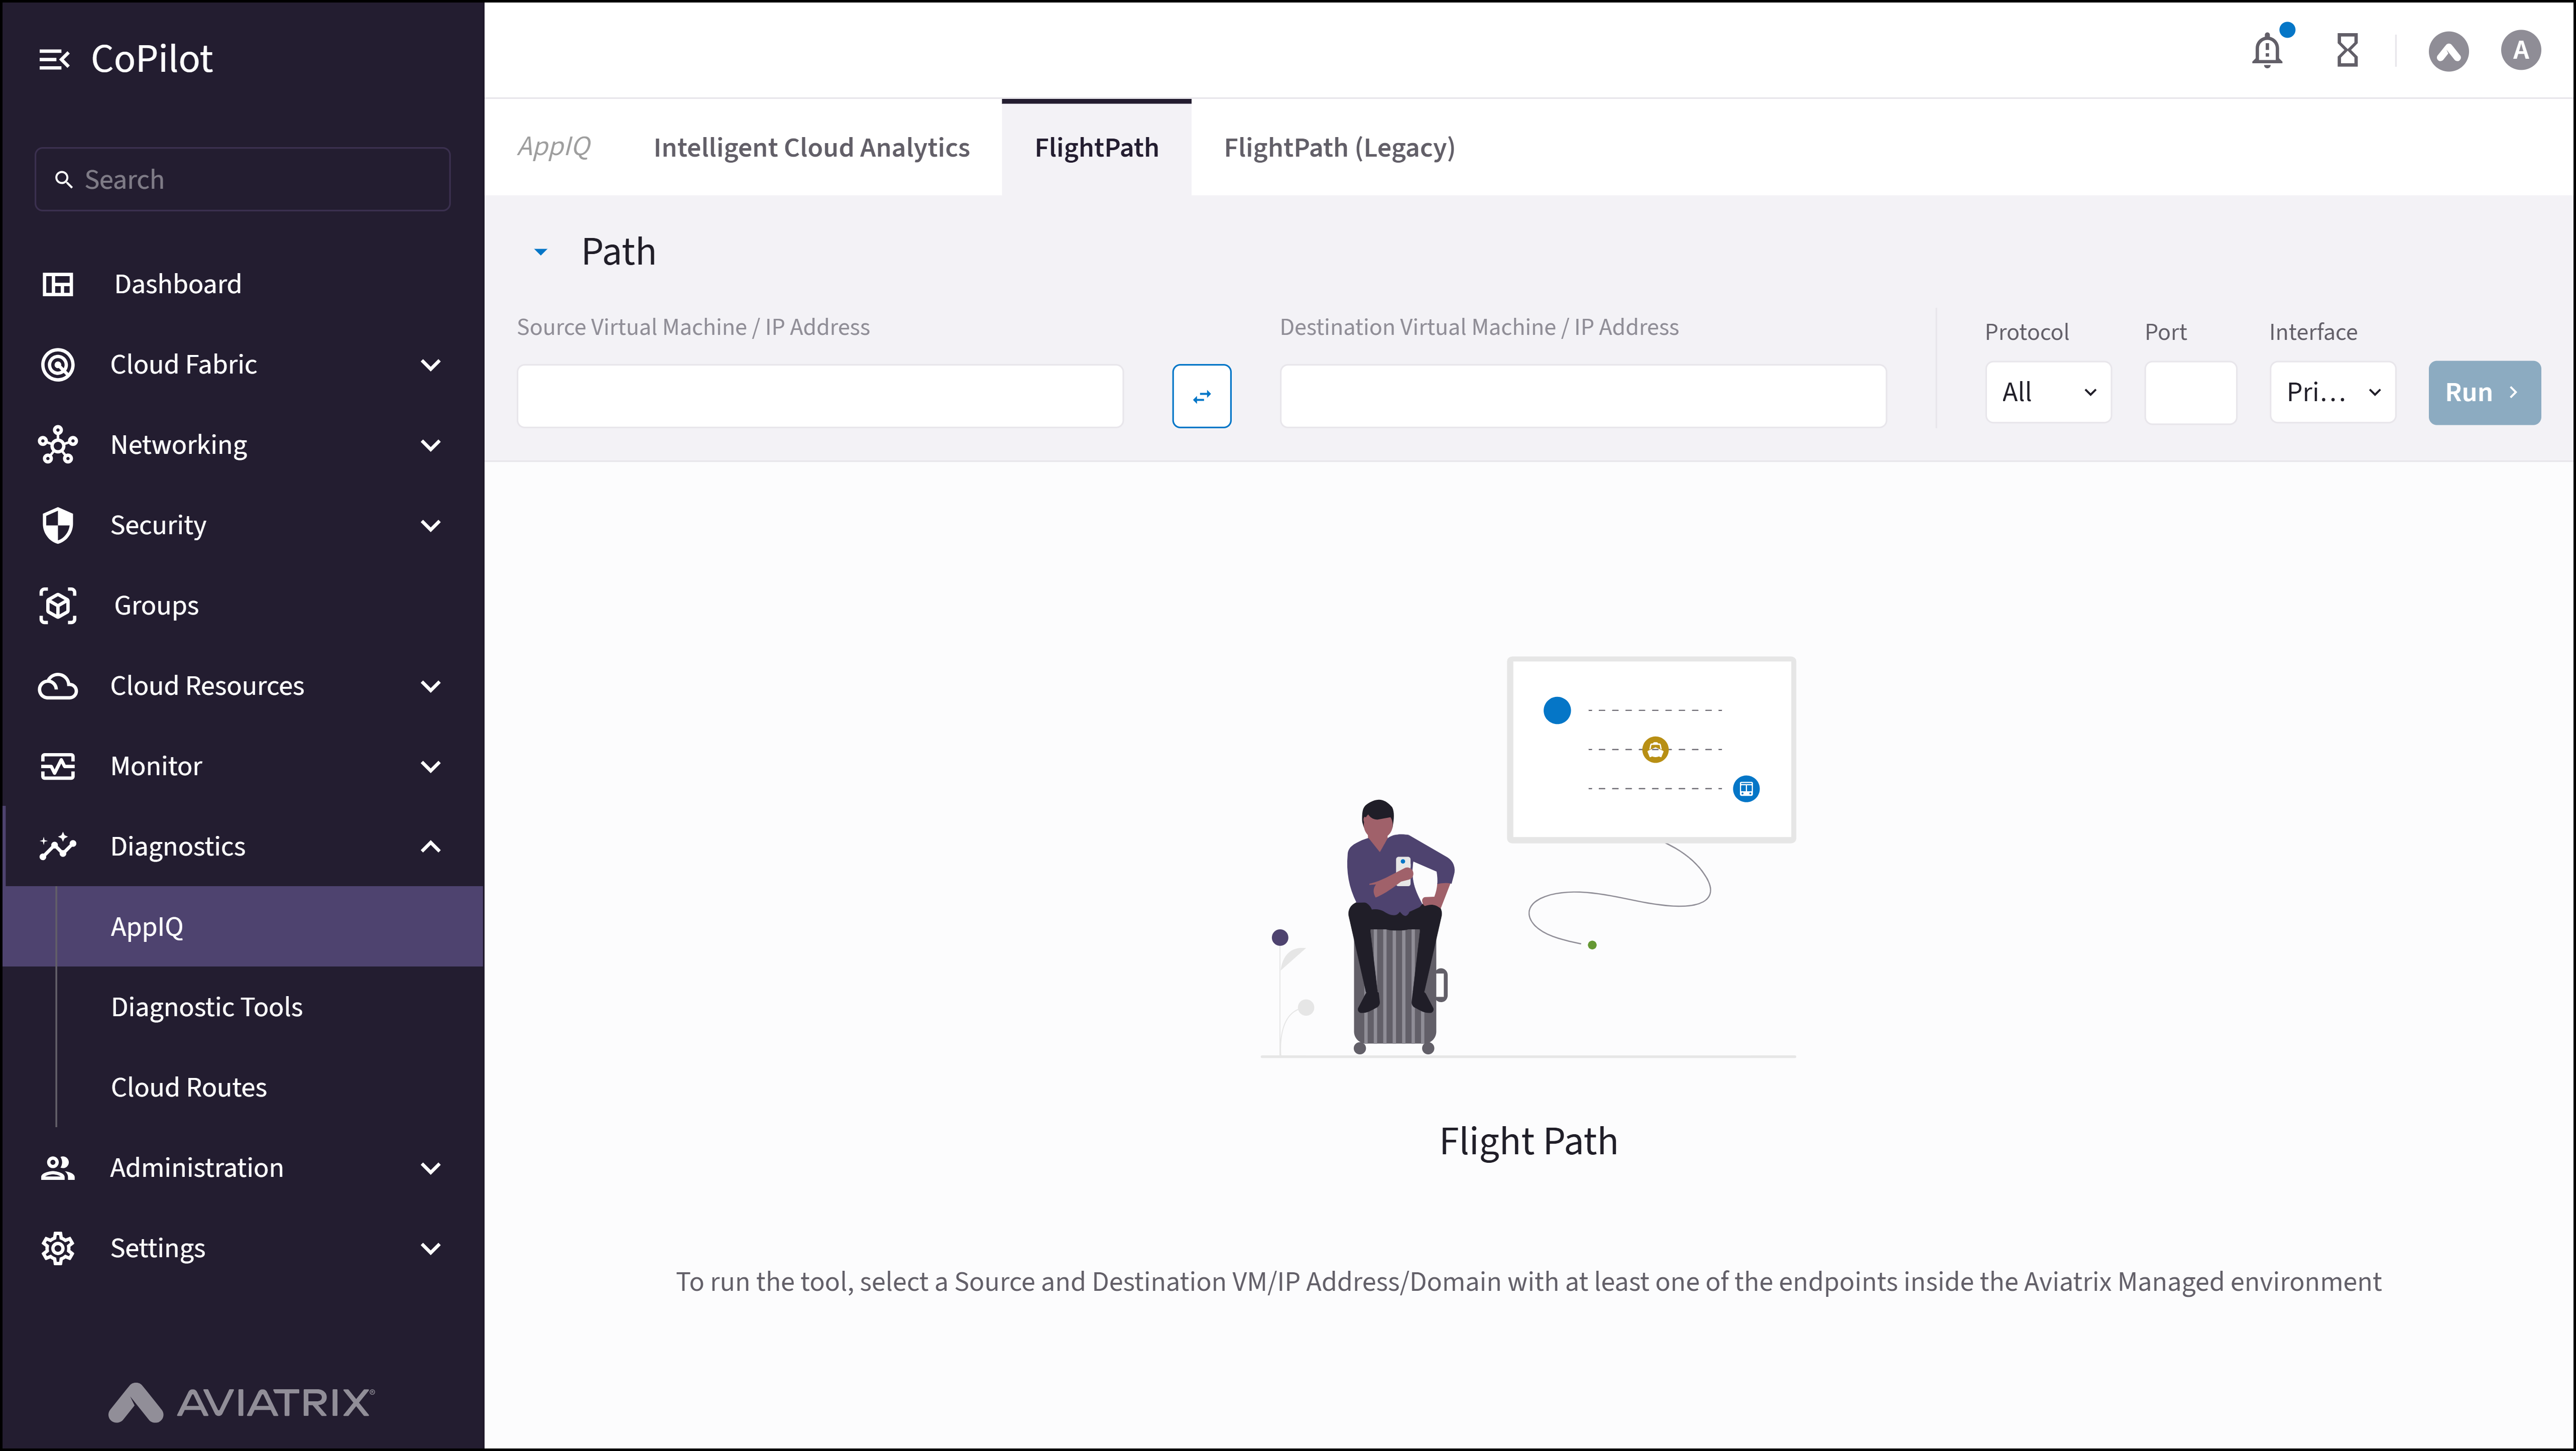
- FlightPath
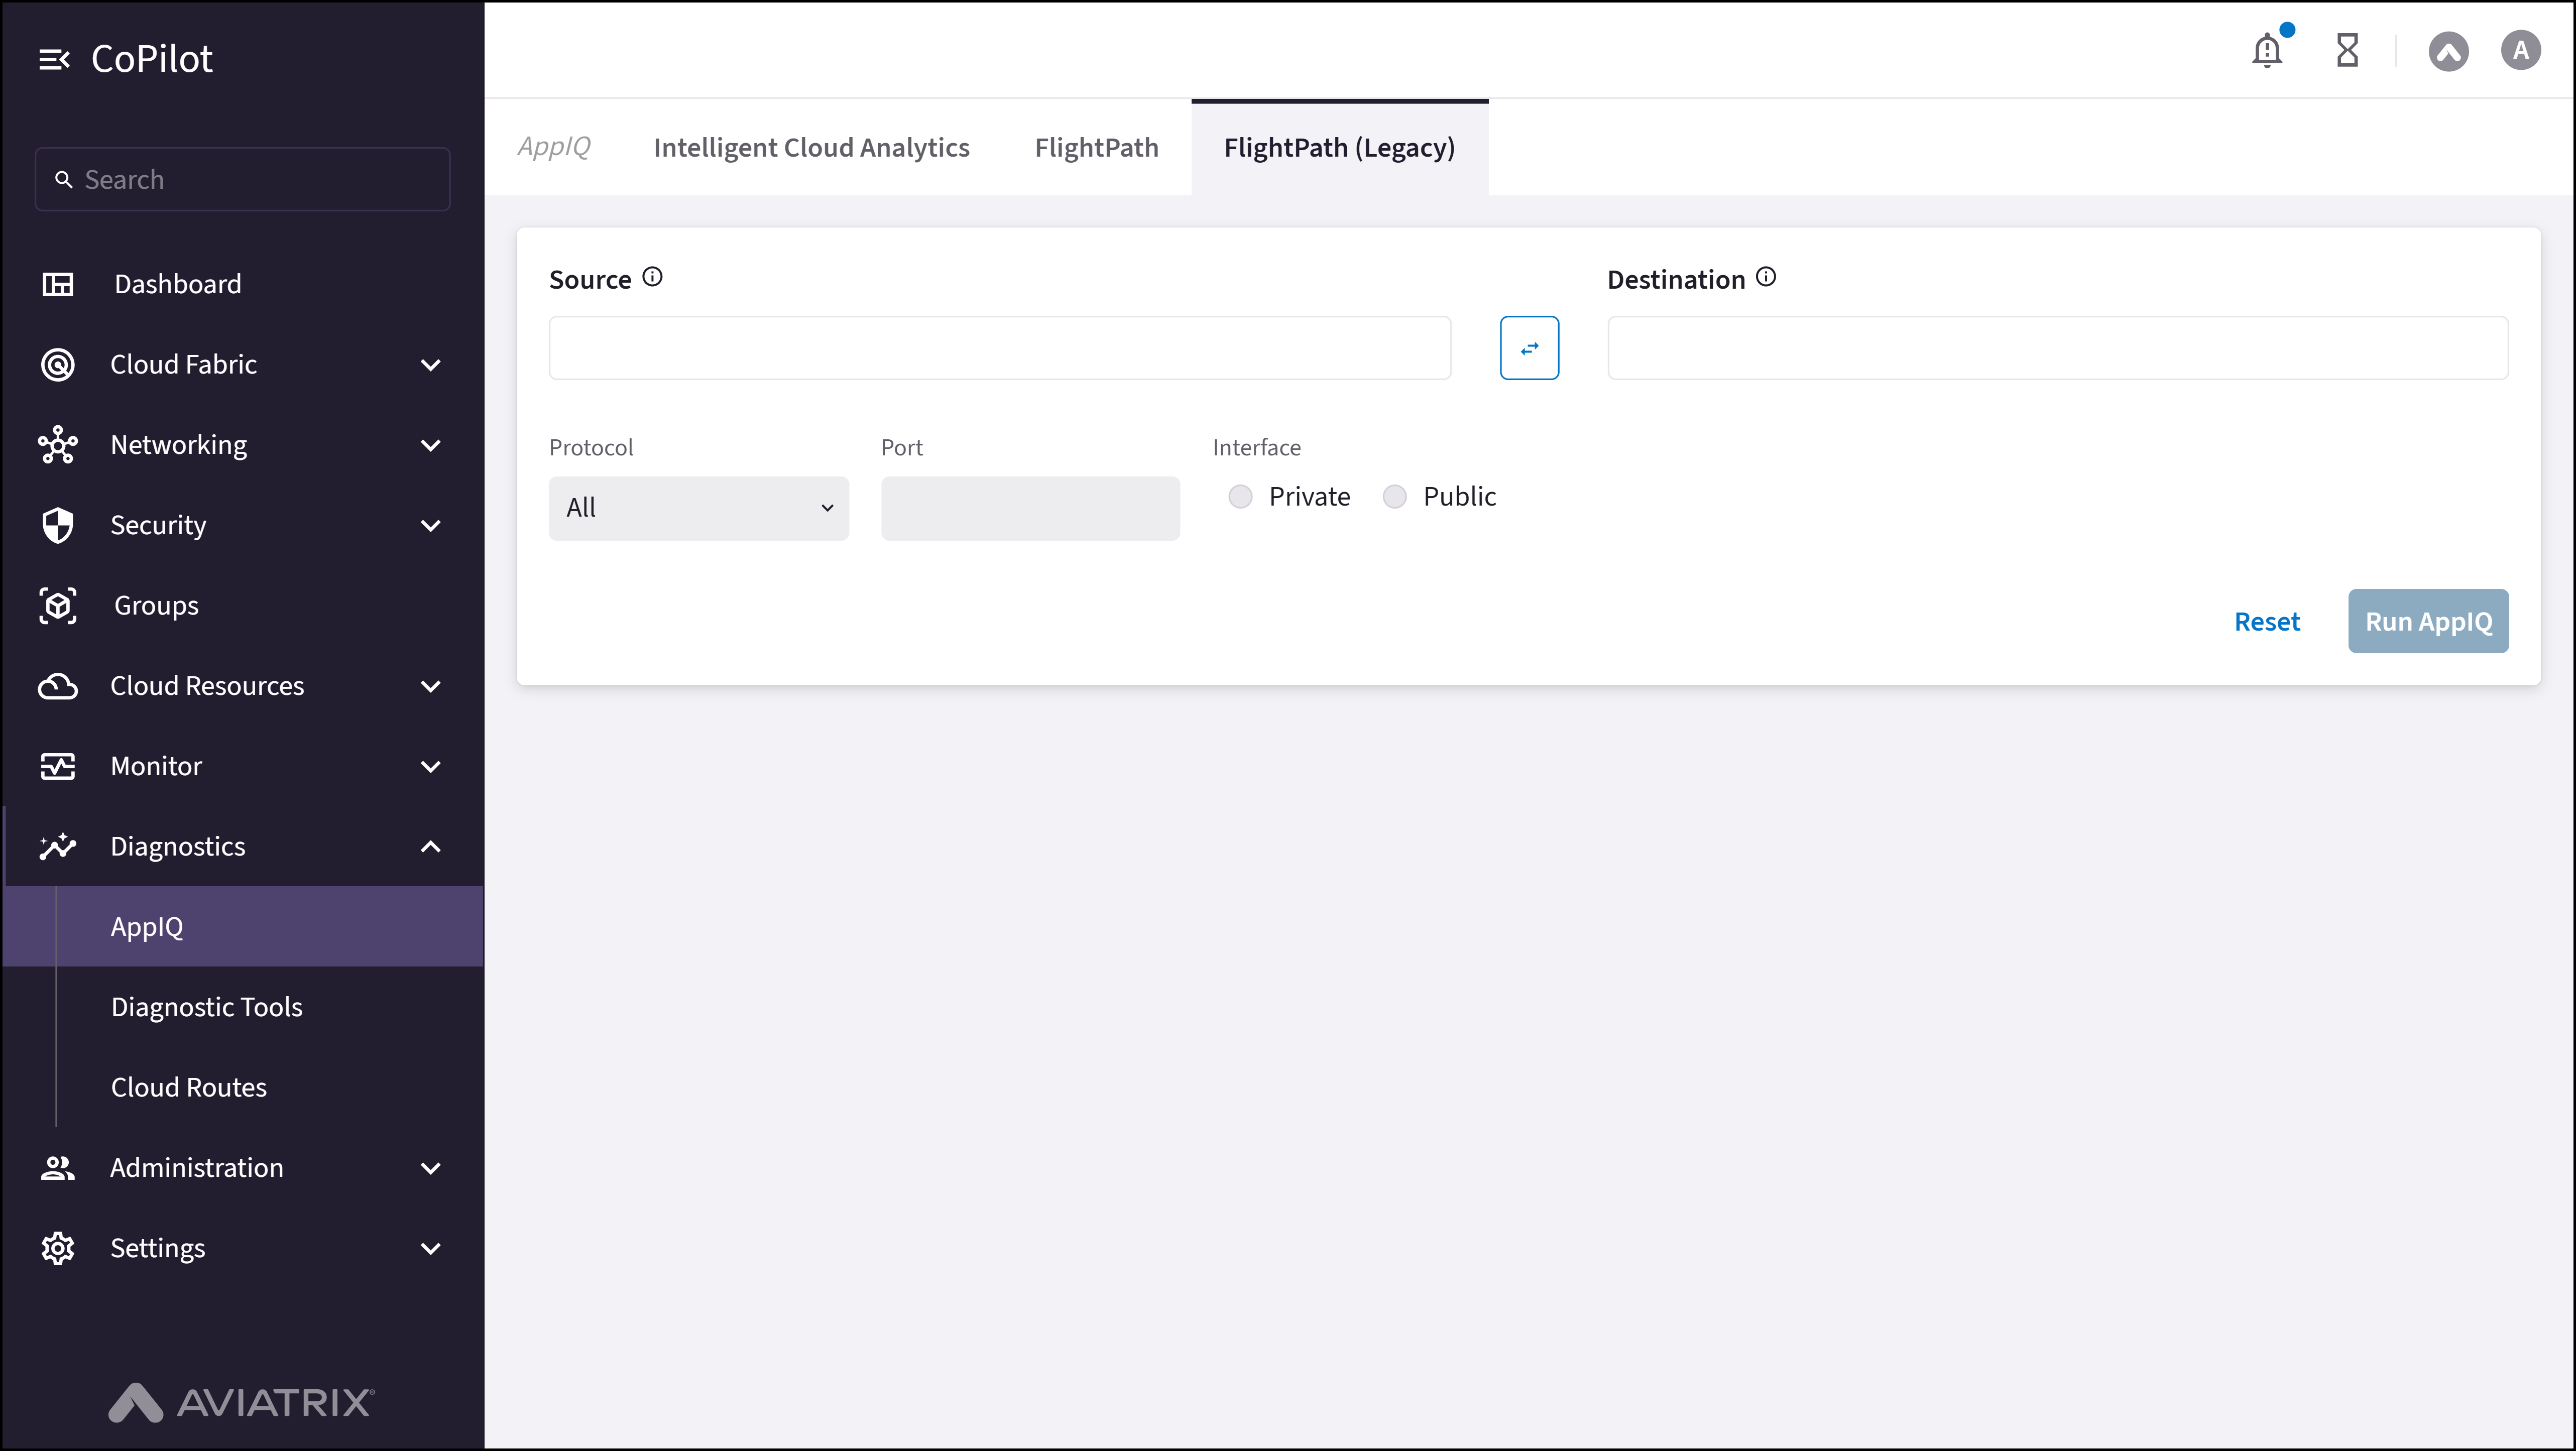
- FlightPath (Legacy)
Purpose
The Intelligent Cloud Analytics page shows cloud fabric topology, application connections, inter-app latencies, and security metrics. You can edit the view configuration to change which apps, SmartGroups, and connections are displayed.Elements
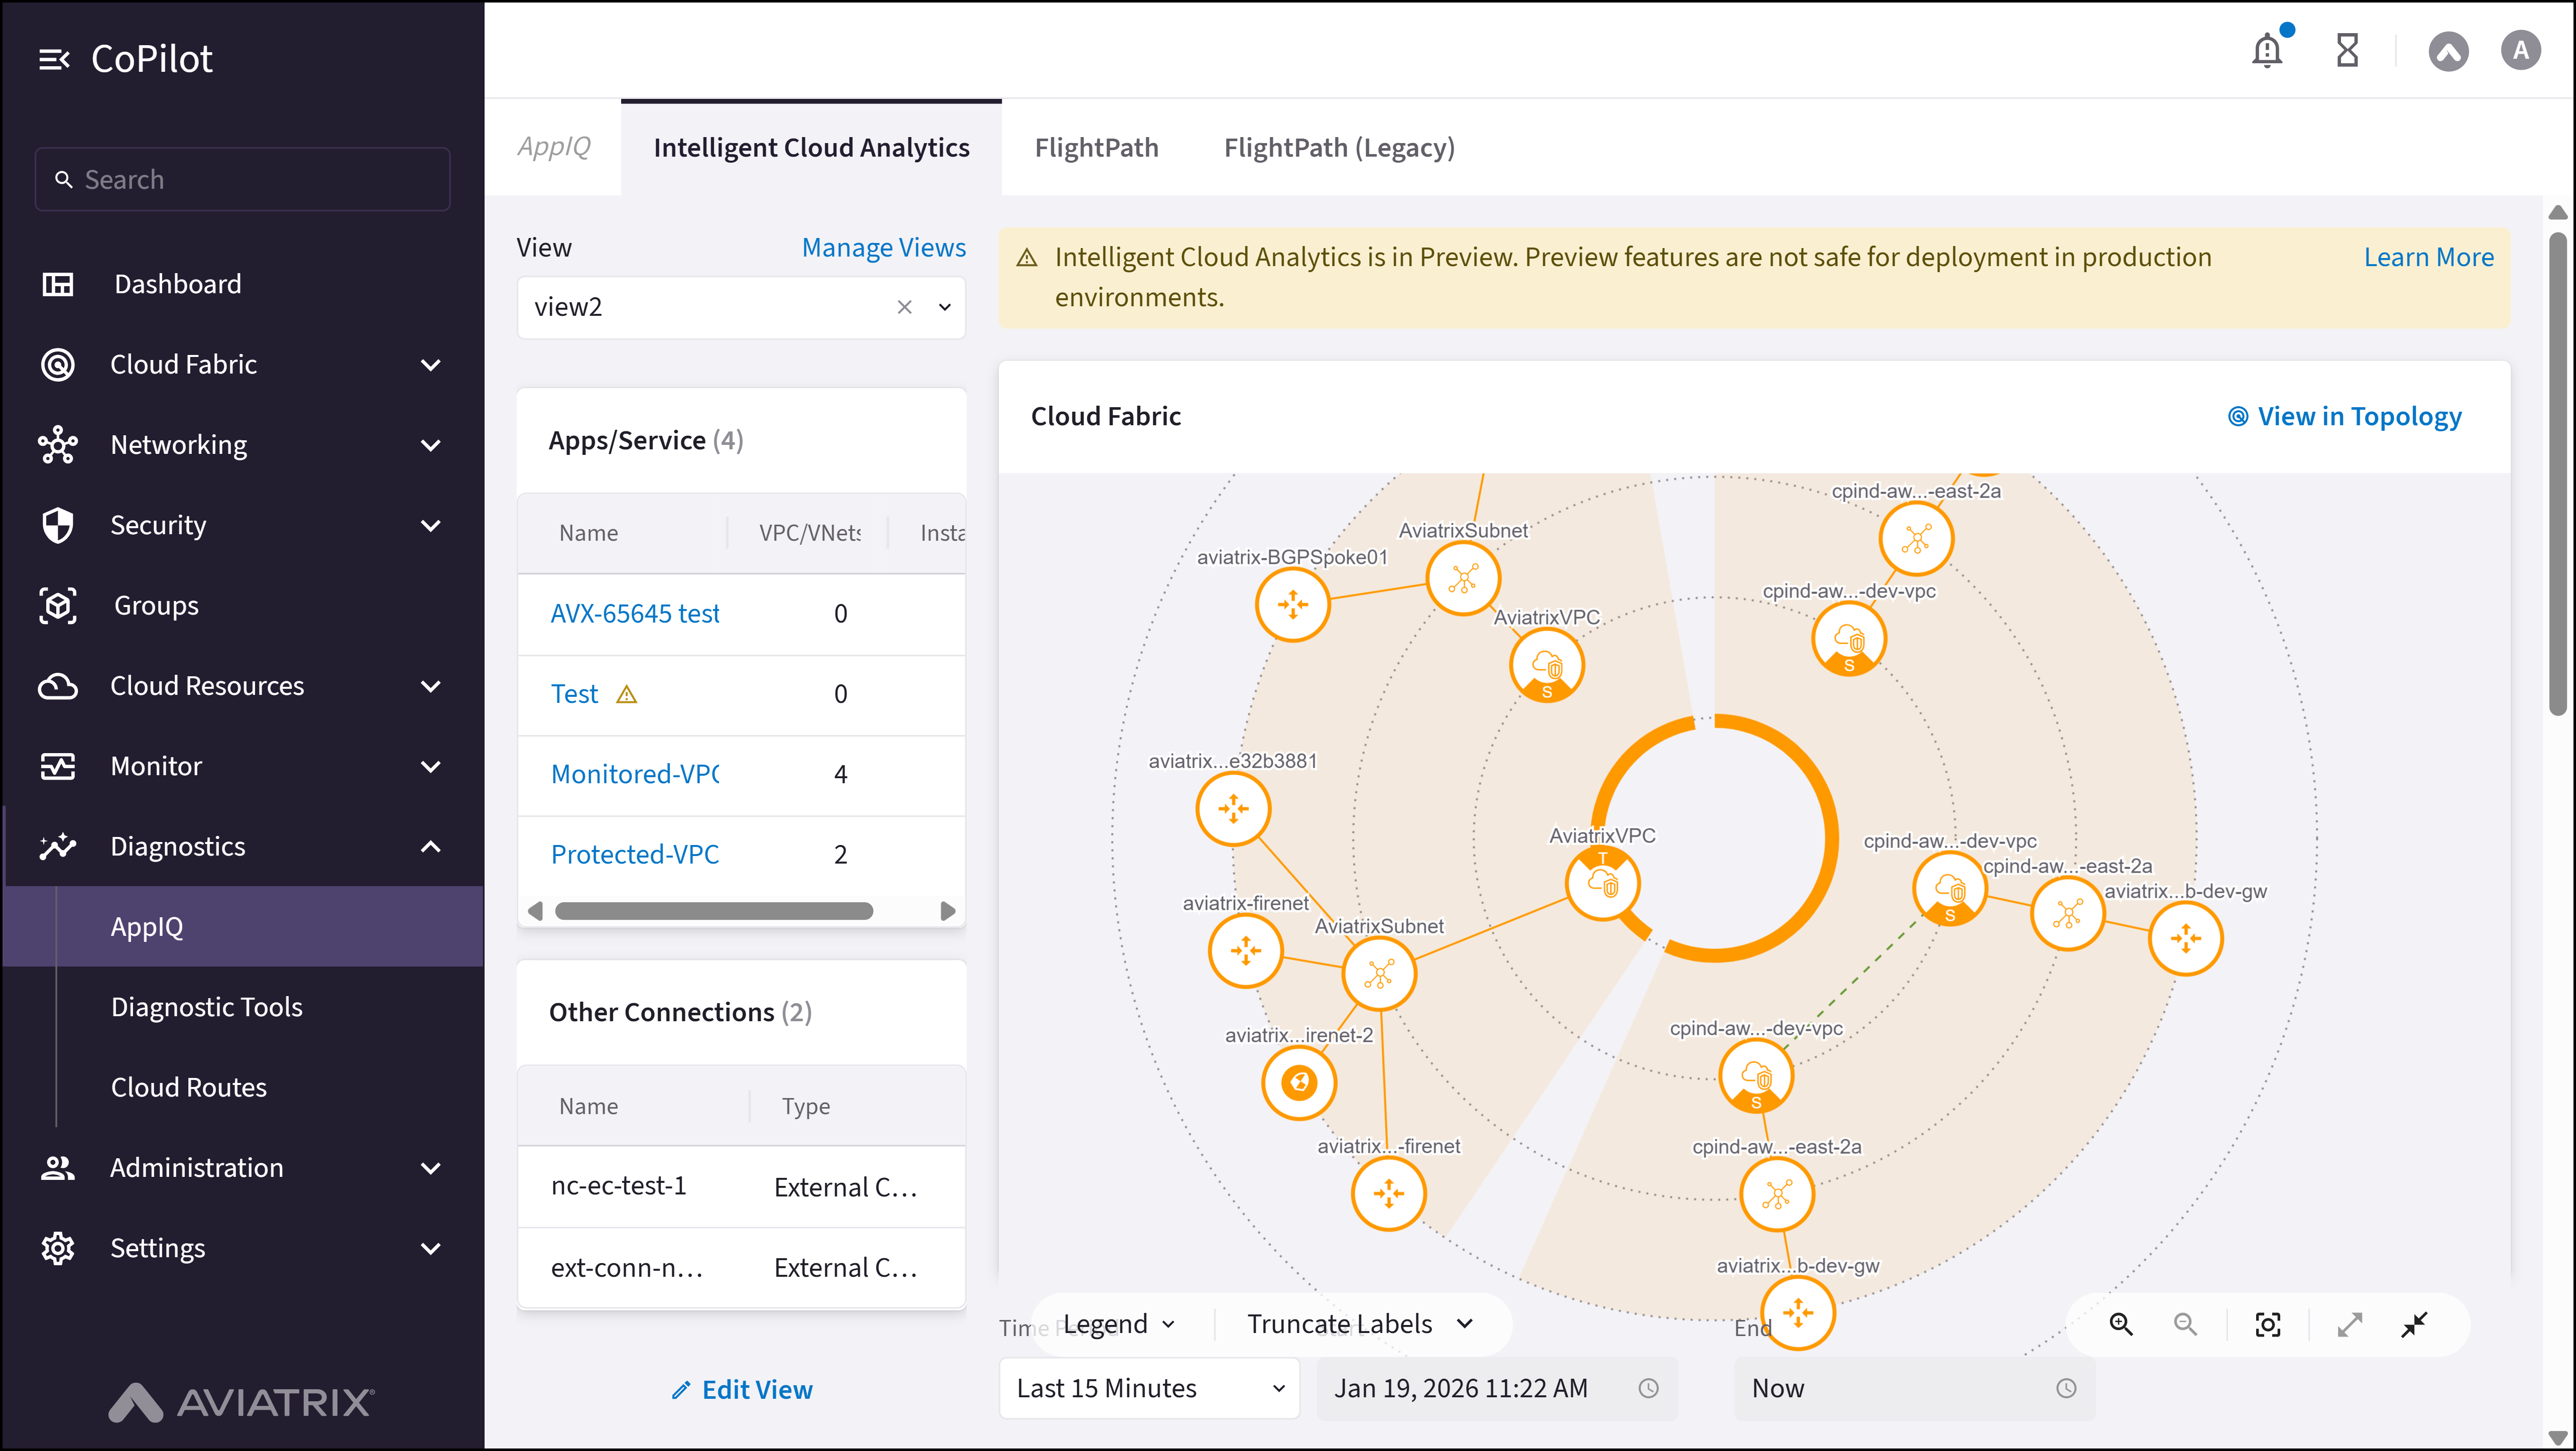
- View: Dropdown to select view.
- Manage Views: Links to manage views.
- Edit View button: Opens dialog to edit view configuration.
- Apps/Service table: Shows applications and services with VPC/VNets and instances.
- Other Connections table: Shows external connections and their types.
- View in Topology button: Navigates to topology view.
- Cloud Fabric visualization: Interactive topology diagram showing cloud fabric connections.
- Legend button: Shows legend for topology diagram.
- Truncate Labels: Truncates labels in topology diagram.
- Time Period: Selects time period (e.g., Last 15 Minutes).
- Start: Start date and time field.
- End: End date and time field.
- Inter App Latencies: Heat map showing latency between applications.
- Heat Map: Selects heat map view for Inter App Latencies.
- Troubleshoot with FlightPath button: Opens FlightPath troubleshooting.
- Connection Latencies table: Shows connection latencies with source, destination, and latency.
- Traffic Sent: Top 5: Chart showing top 5 traffic sent.
- Traffic Received: Top 5: Chart showing top 5 traffic received.
- Security dropdown: Selects the App/Service for security metrics.
- Distributed Cloud Firewall: Shows Distributed Cloud Firewall rules count.
- Network Domains: Shows Network Domains count.
- Active Threats: Shows Active Threats count.
- Anomalies Detected: Shows Anomalies Detected count.
- Egress FQDN: Shows Egress FQDN count.
Actions
View Intelligent Cloud Analytics
View Intelligent Cloud Analytics
To view intelligent cloud analytics:
- Go to Diagnostics > AppIQ > Intelligent Cloud Analytics.
- The page appears with Cloud Fabric visualization, Apps/Service table, Other Connections table, Inter App Latencies heat map, Connection Latencies table, and traffic charts.
- Use View to switch views. Optionally, use Time Period, Start, and End to set the time range.
- Use Security dropdown to view Distributed Cloud Firewall, Network Domains, Active Threats, Anomalies Detected, and Egress FQDN for the selected App/Service.
- Optionally, click View in Topology to open topology view, Legend or Truncate Labels for the diagram, or Troubleshoot with FlightPath to run path analysis.
Parameter Details
| CoPilot Parameter Name | Description |
|---|---|
| Name | Shows application or service name (Apps/Service). |
| VPC/VNets | Shows VPC/VNet count for application. |
| Instances | Shows instance count for application. |
| Type | Shows connection type (Other Connections). |
| Source | Shows source endpoint. |
| Destination | Shows destination endpoint. |
| Latency | Shows connection latency. |
Edit Intelligent Cloud Analytics View
Edit Intelligent Cloud Analytics View
To edit the Intelligent Cloud Analytics view:
- Go to Diagnostics > AppIQ > Intelligent Cloud Analytics.
- Click Edit View to open the Edit View dialog.
- Update Name, SmartGroups, Other Application/Services, External Connection (S2C), or Edge as needed.
- Save the configuration.
Parameter Details
| CoPilot Parameter Name | Description |
|---|---|
| Name | Enter view name. |
| SmartGroups | Select SmartGroups. |
| Other Application/Services | Select other applications/services. |
| External Connection (S2C) | Select external connections. |
| Edge | Select Edge connections. |