- System Health
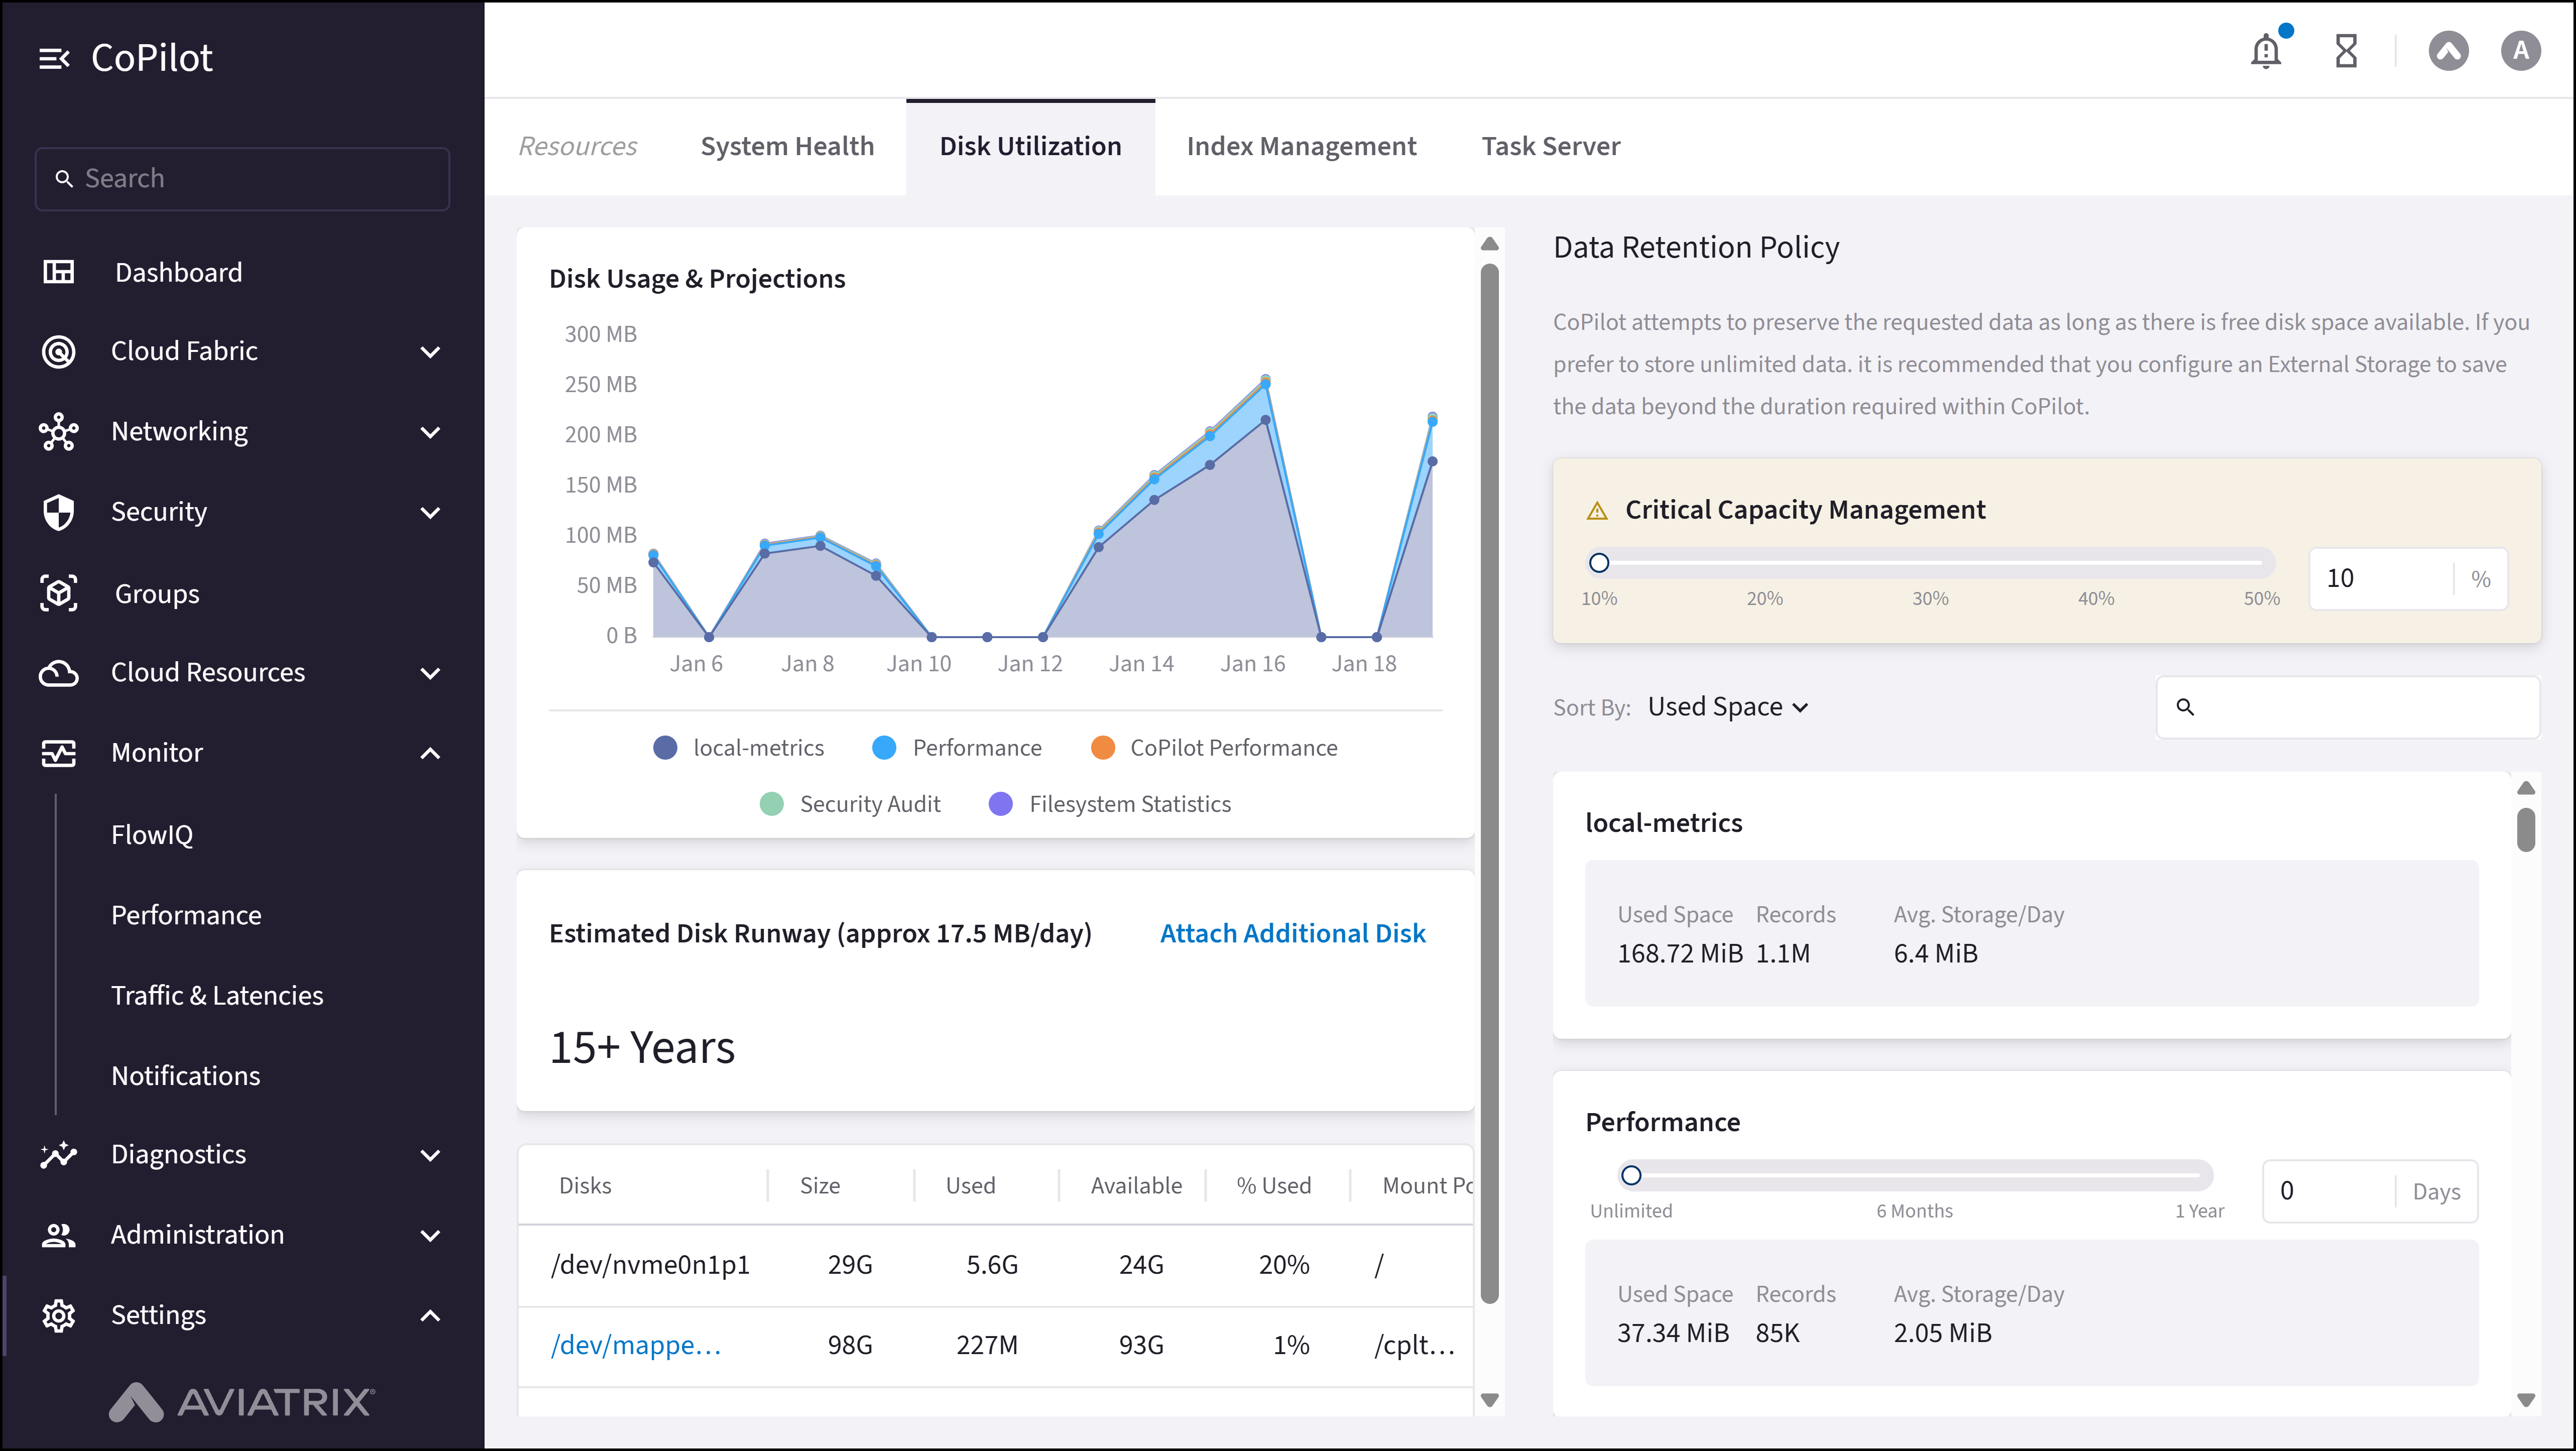
- Disk Utilization
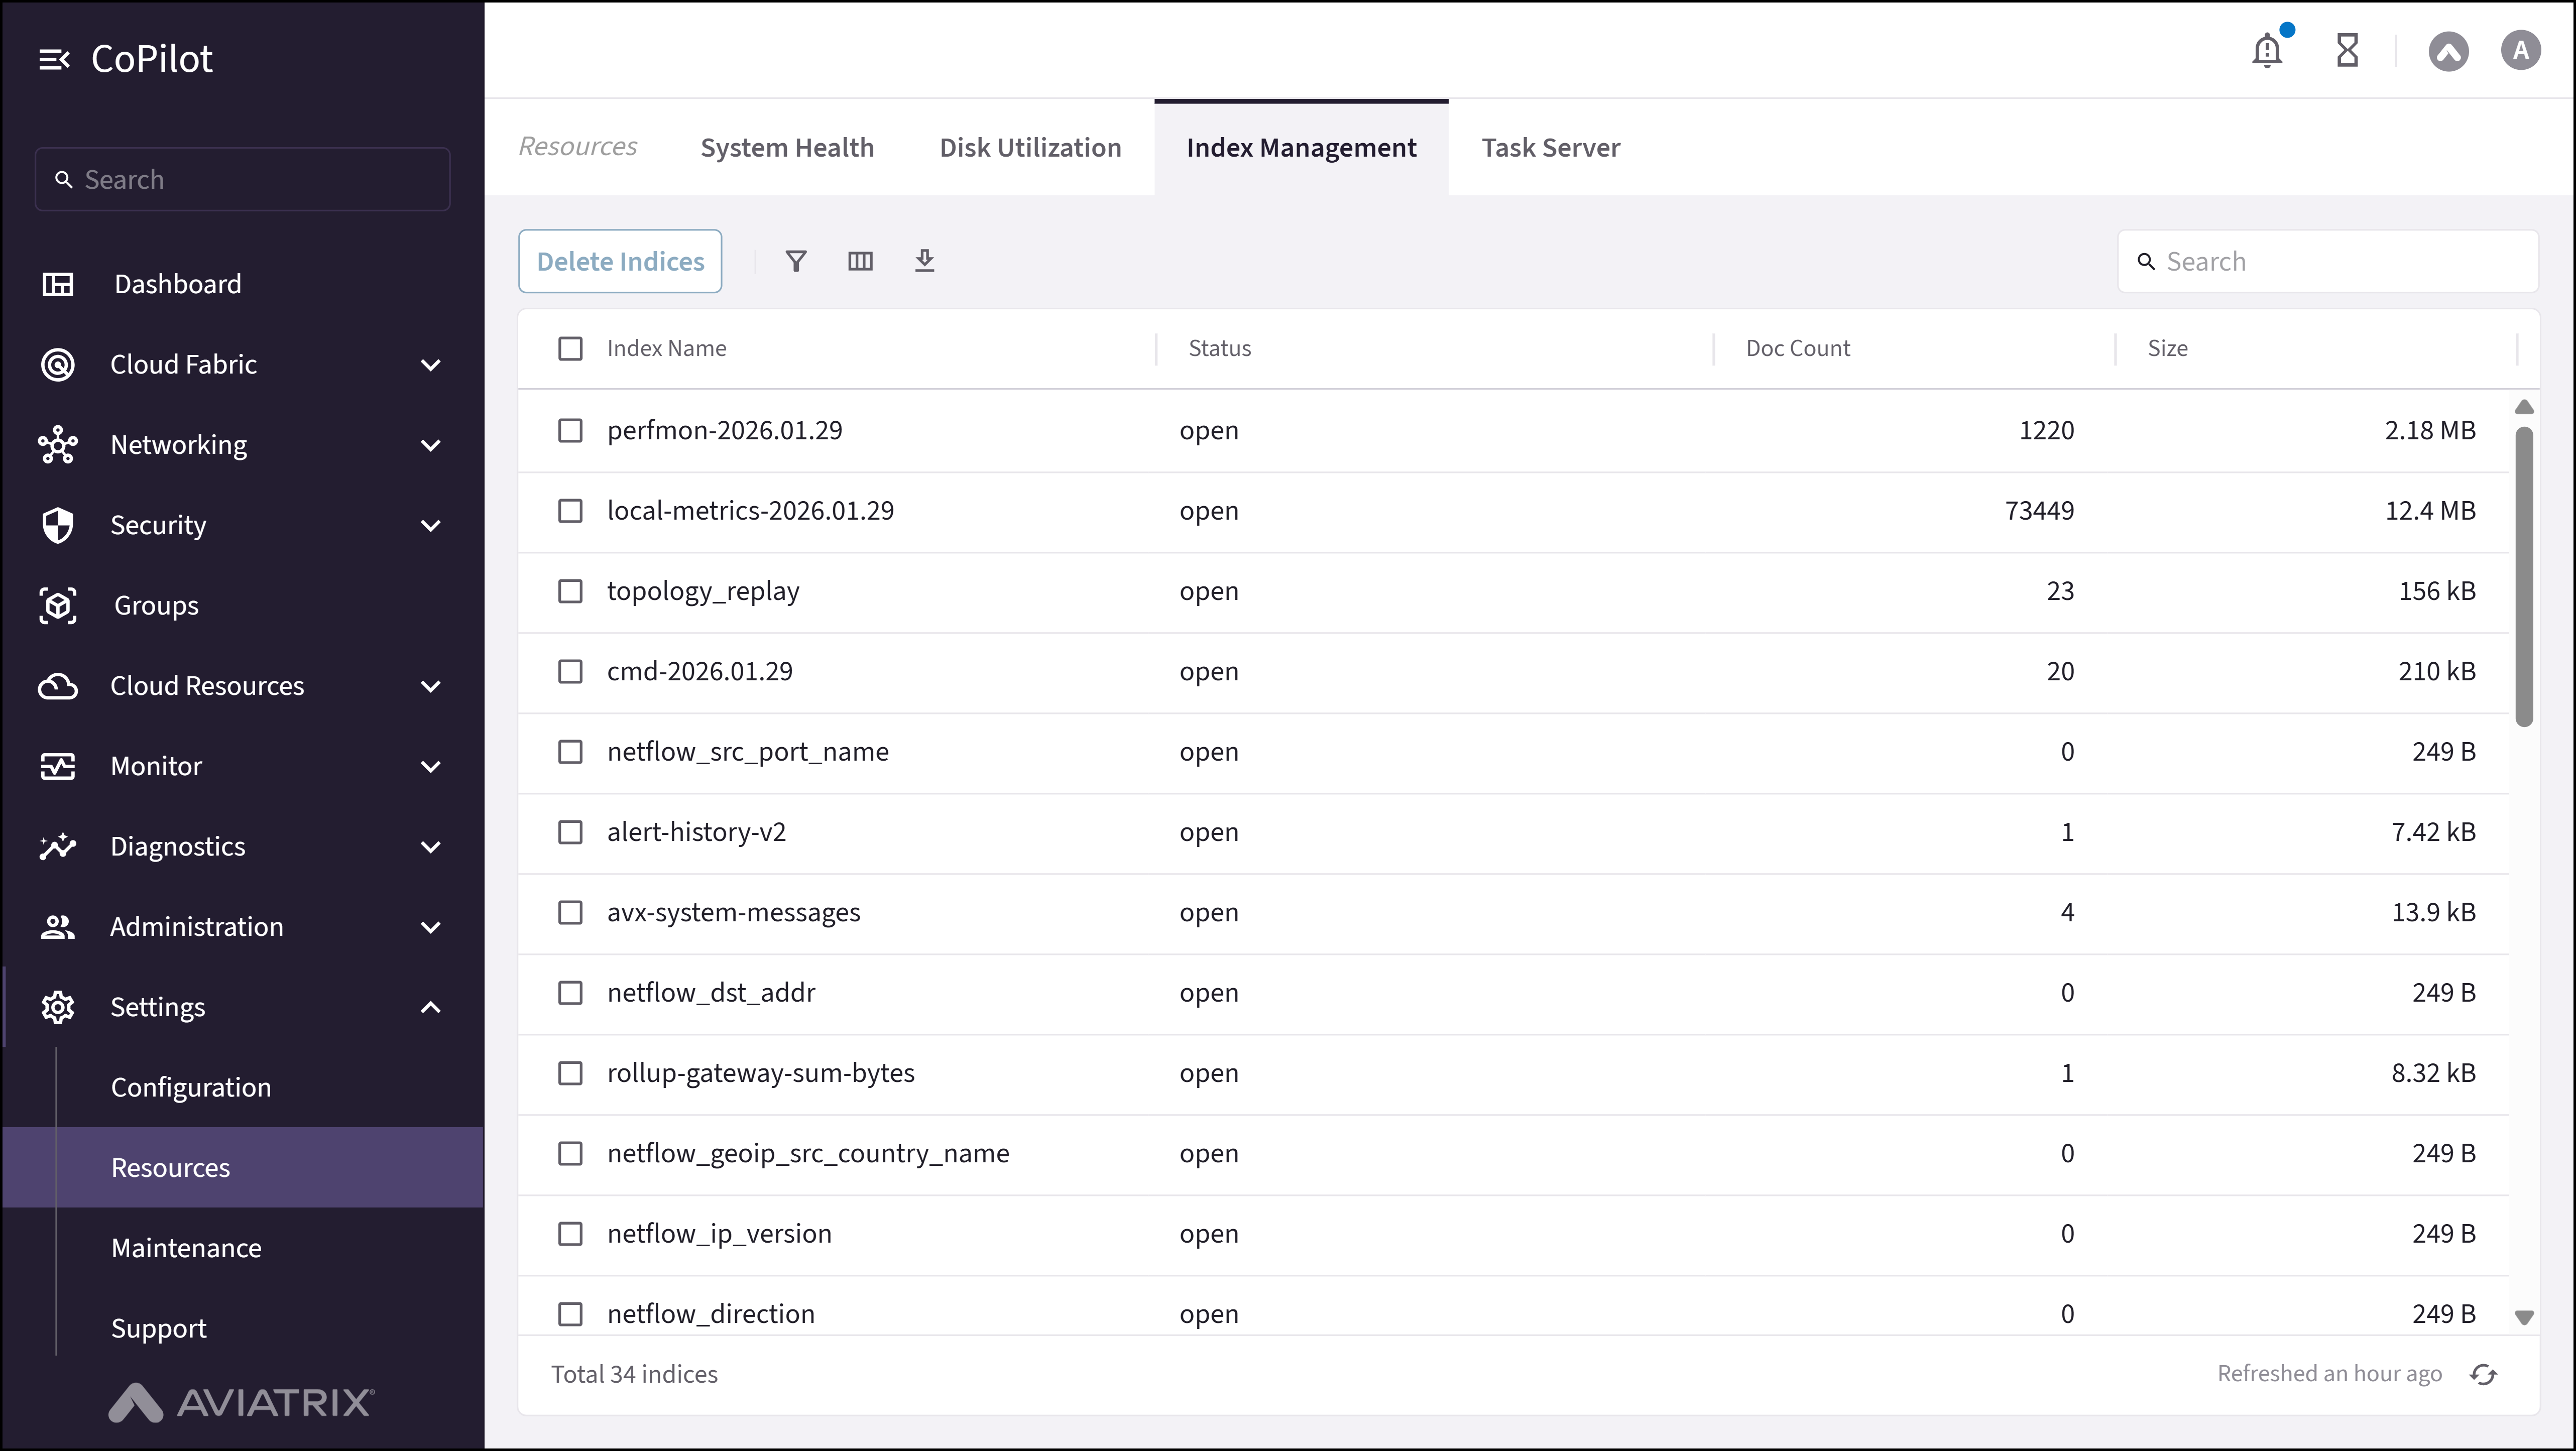
- Index Management
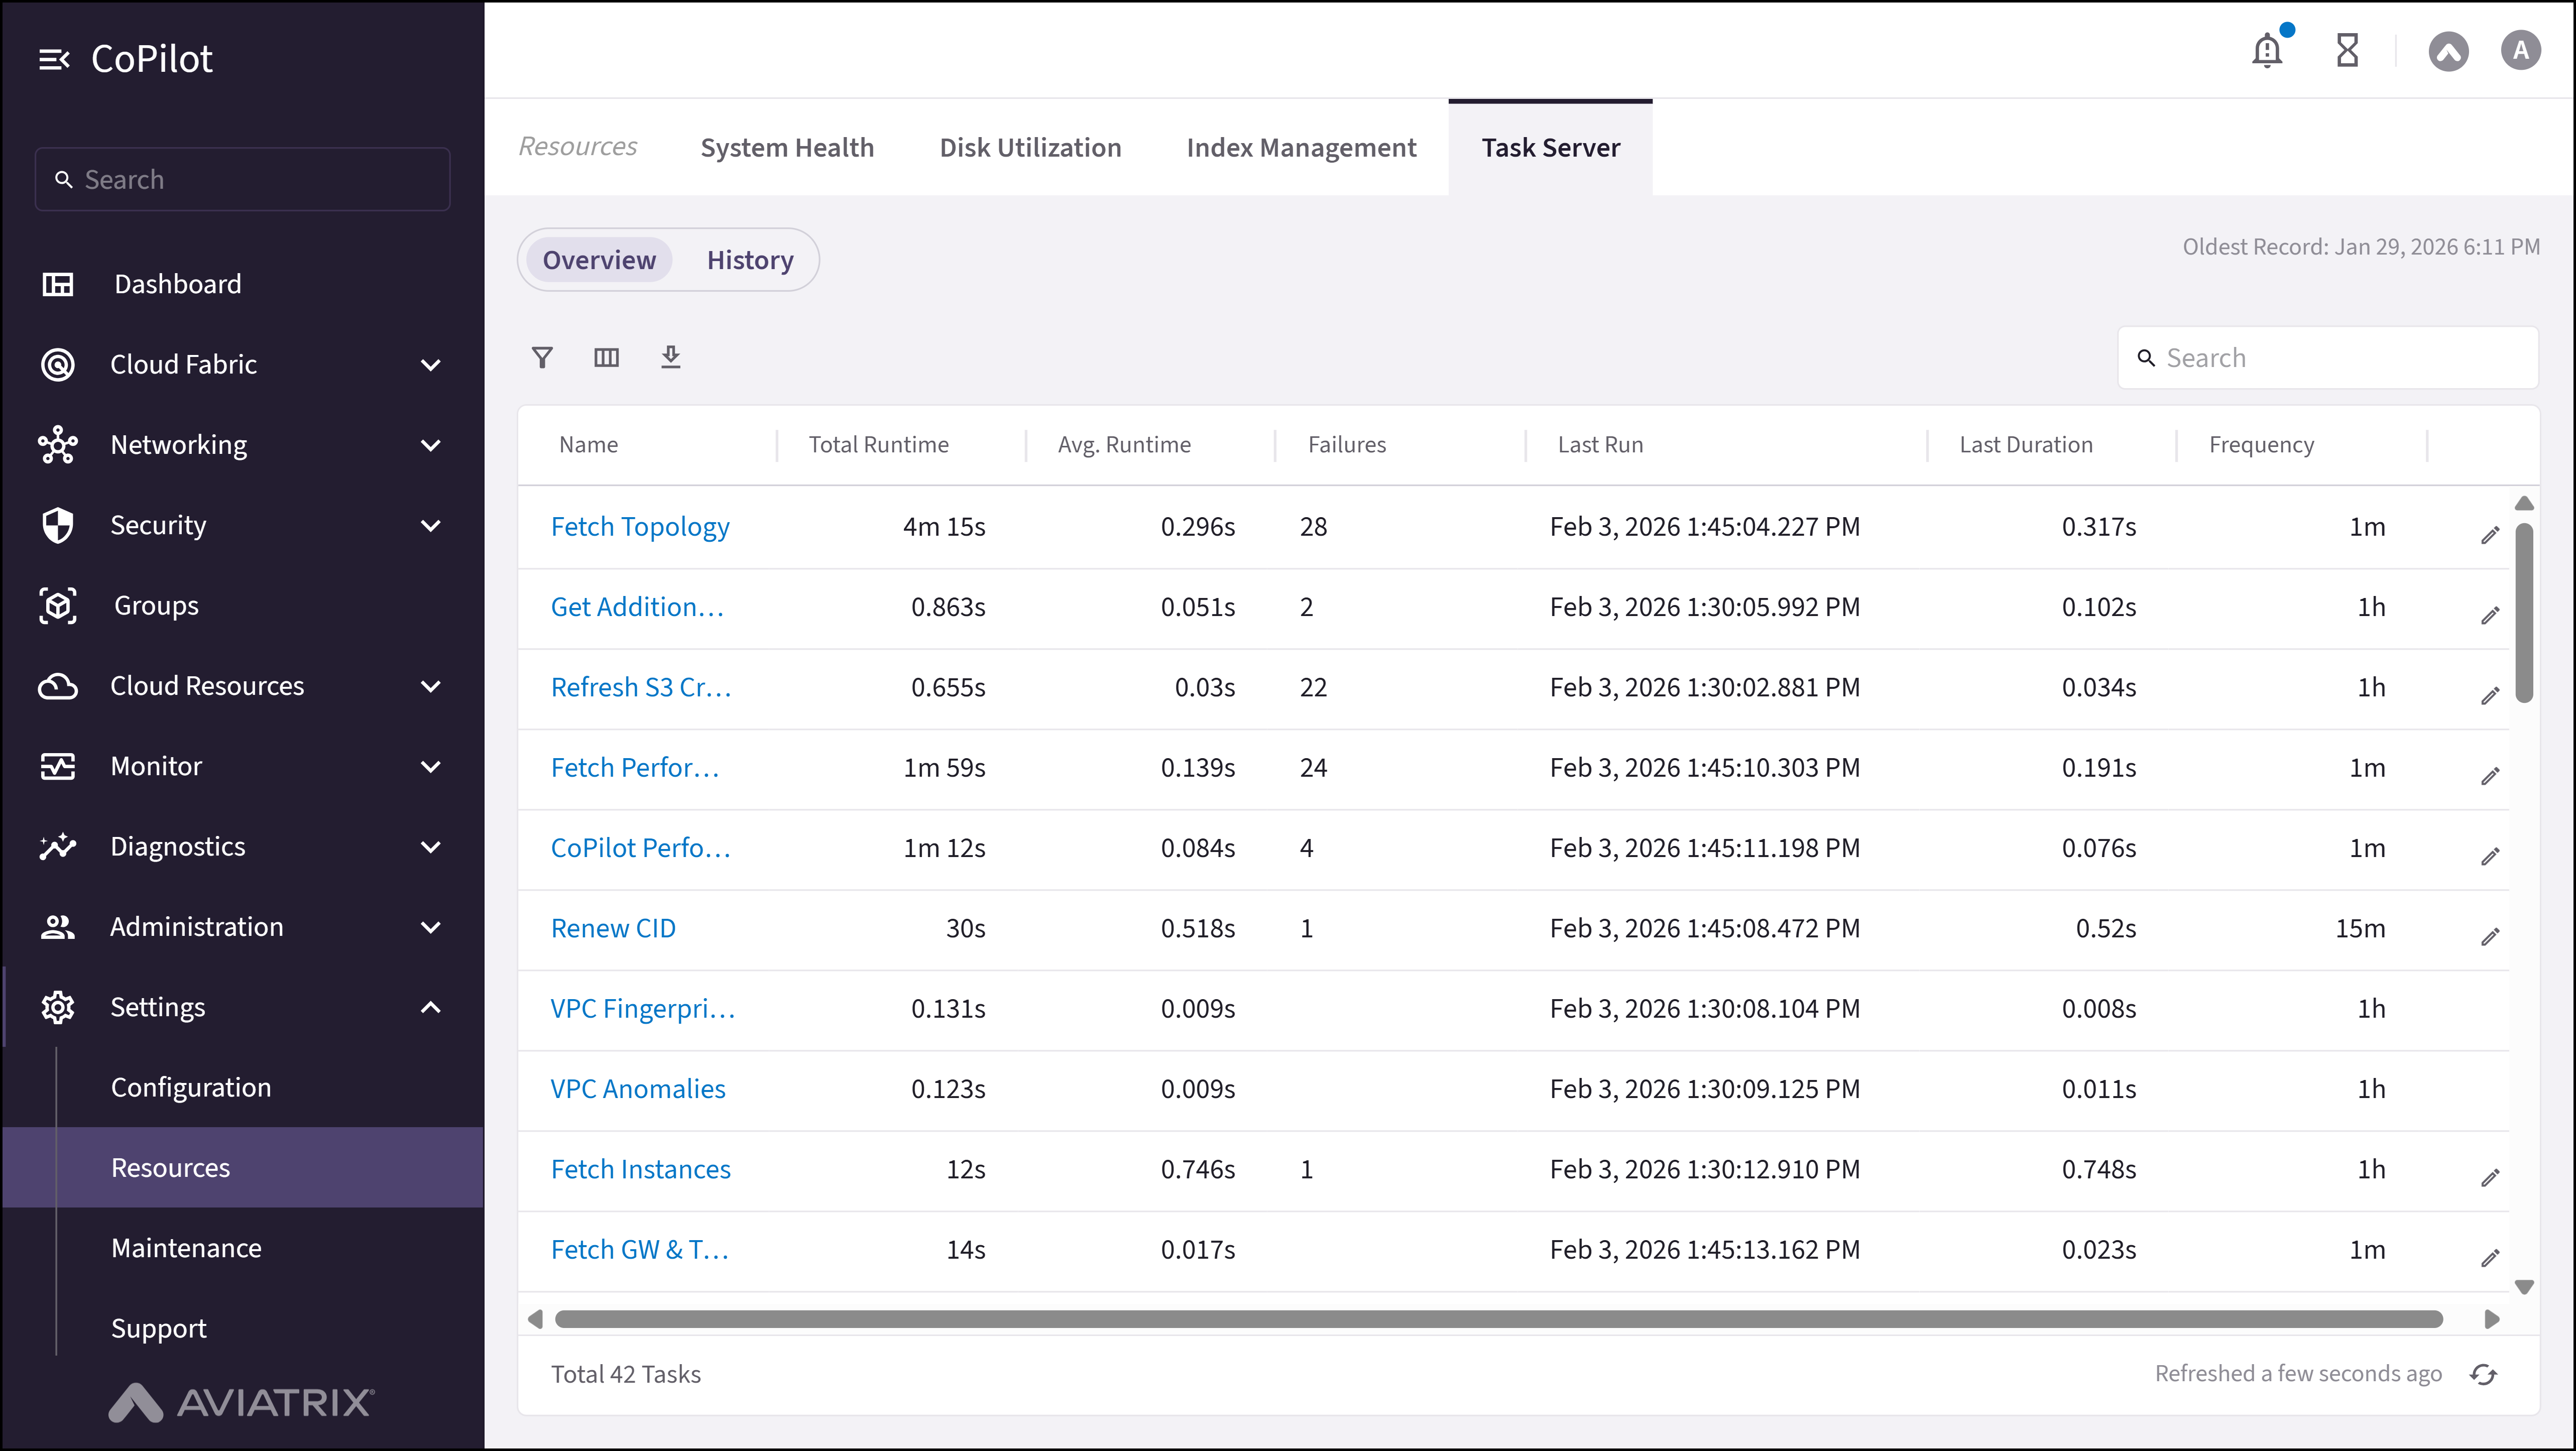
- Task Server
Purpose
The System Health page monitors system health metrics for Controller and CoPilot (system health) or Controller only (network health), views overall health status, services status, alerts, and creates alert configurations.Elements
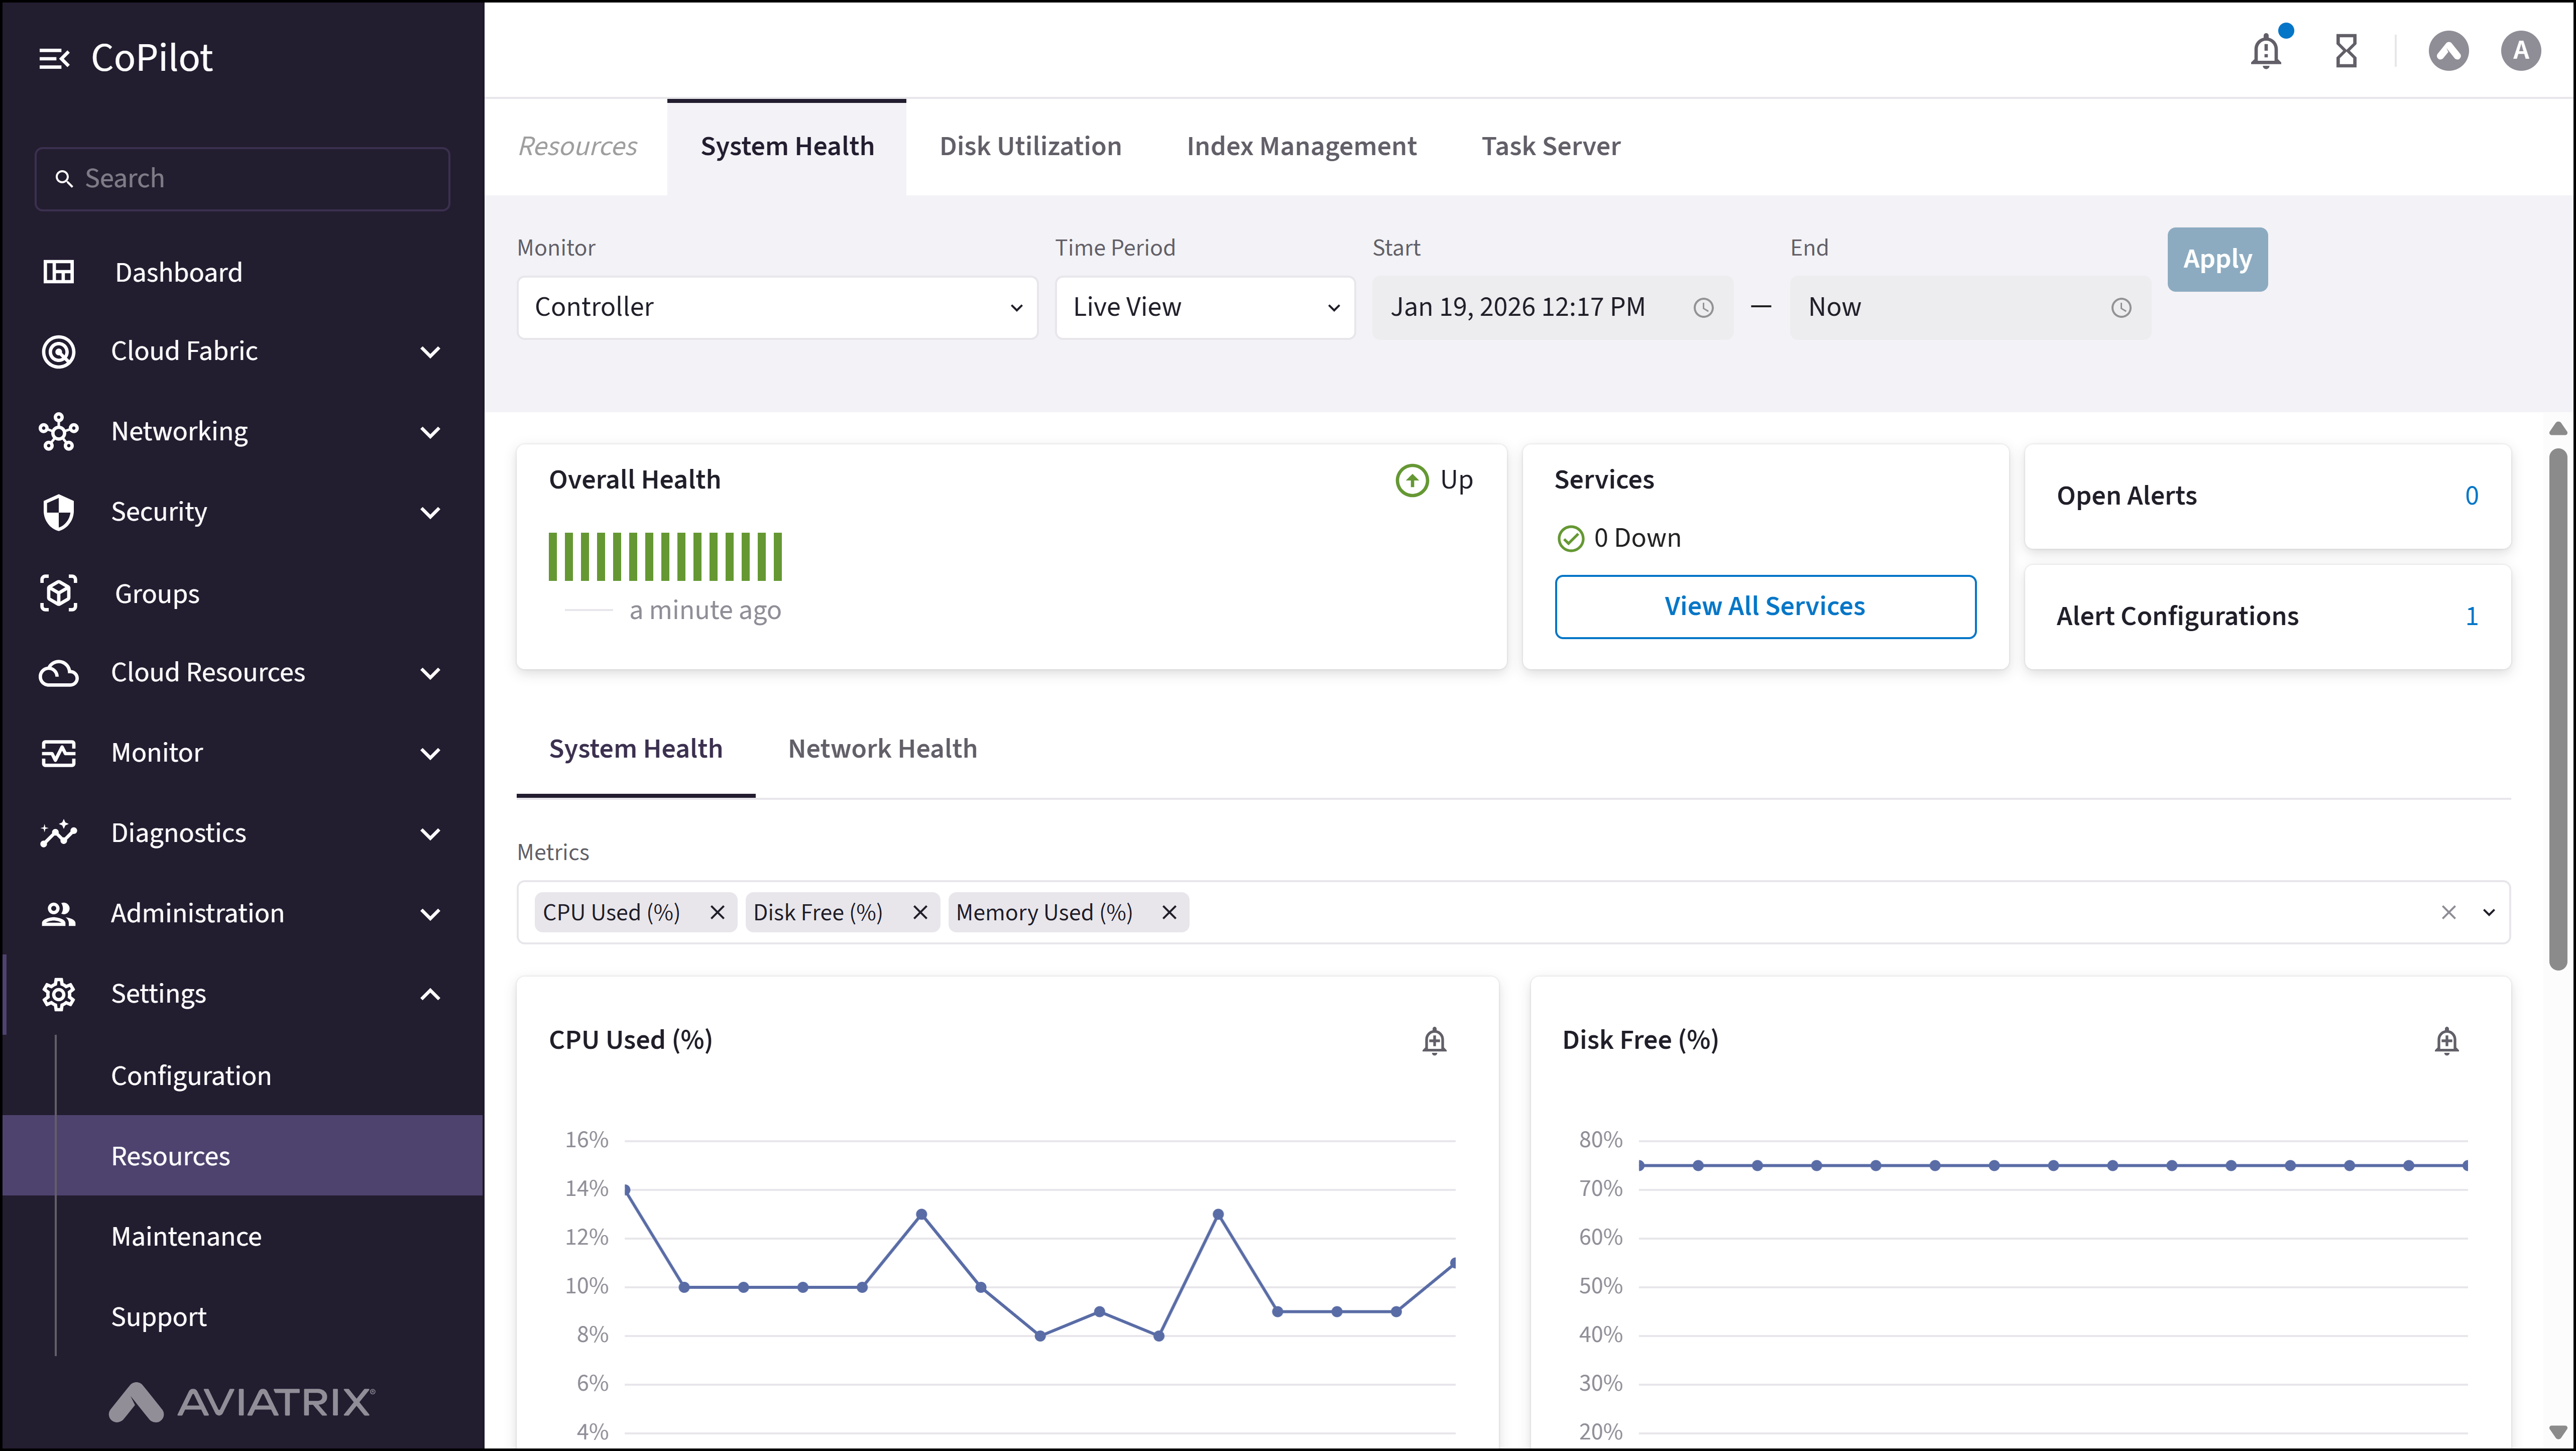
- Monitor: Dropdown to select monitor (Controller or CoPilot for system health; Controller for network health).
- Time Period: Dropdown to select time period (Live View, Last Hour, etc.).
- Start: Text field for start date and time.
- End: Text field for end date and time.
- Apply button: Applies the selected time period filters.
- Overall Health: Section displaying overall health status (Up/Down).
- Services: Section showing services status with count of down services and the View All Services button.
- Open Alerts: Section showing count of open alerts.
- Alert Configurations: Section showing count of alert configurations.
- Metrics: Multiselect dropdown for selecting metrics (CPU Used, Disk Free, Memory Used) on system health view.
- Create Alert button: Opens a dialog to create an alert configuration.
Actions
View System Health
View System Health
To view system health:
- Go to Settings > Resources > System Health.
- Select Monitor (Controller or CoPilot), set Time Period or Start/End, and click Apply. Review Overall Health, Services, Open Alerts, Alert Configurations, and Metrics.
- Optionally, click Create Alert to add an alert configuration.
Parameter Details
| CoPilot Parameter Name | Description |
|---|---|
| Monitor | Select the monitor to view health metrics for (Controller or CoPilot). |
| Time Period | Select the time period for viewing health metrics (Live View, Last Hour, Last 24 Hours, etc.). |
| Start | Specify the start date and time for the custom time period. |
| End | Specify the end date and time for the custom time period. |
| Overall Health | Displays the overall health status of the selected monitor (Up or Down). |
| Services | Shows the number of services that are down and provides a button to view all services. |
| Open Alerts | Displays the count of currently open alerts. |
| Alert Configurations | Displays the count of configured alert configurations. |
| Metrics | Select one or more metrics to display (CPU Used, Disk Free, Memory Used). |
View Network Health
View Network Health
To view network health:
- Go to Settings > Resources > System Health and select Monitor (Controller) for network health view.
- Set Time Period or Start/End and click Apply. Review Overall Health, Services, Open Alerts, and Alert Configurations.