

- Remote Access & Logs
- Debugging Tools
- Internal
Purpose
The Remote Access & Logs page manages remote support access for Aviatrix Virtual Machines, uploads log bundles to cloud storage, and displays recent log bundle activities.Elements

- Upload Log Bundles button: Opens a dialog to upload log bundles for selected Aviatrix Virtual Machines and gateways to cloud storage.
- Aviatrix Virtual Machines table: Table with Type, Instance Name, Public IP, Management IP, Remote Support (Enable), and a Log Bundle actions menu per row. The Controller row’s menu has only Upload to Cloud; the CoPilot App Instance row’s menu also has Download.
- Recent Activities table: Table with Timestamp, Entity, and Log Bundle Name, plus a total count and Refresh button.
Actions
View Remote Access & Logs
View Remote Access & Logs
To view remote access and logs:
- Go to Settings > Support > Remote Access & Logs.
- The page appears with the Aviatrix Virtual Machines table and Recent Activities. Use Remote Support (Enable) or the Log Bundle menu (Upload to Cloud, Download) per row.
- Optionally, click Refresh to update Recent Activities.
Upload Log Bundles
Upload Log Bundles
To upload log bundles:
- Go to Settings > Support > Remote Access & Logs.
- Click Upload Log Bundles (or use a row’s Log Bundle > Upload to Cloud menu item).
- In the dialog, select one or more Aviatrix Virtual Machines (Controller, CoPilot App Instance) and/or Gateways.
- Click Upload.
Purpose
The Debugging Tools page provides internal database and certificate debugging tools — MongoDB, etcd, and mTLS — selected from a Tools list.Warning: The MongoDB tool can modify or delete data directly in the
database backing Controller and CoPilot. Use it only when directed by Aviatrix
Support.
Elements

- Tools list: Left-side list to select the active tool (MongoDB, etcd, mTLS); collapsible.
- MongoDB: Database dropdown; Collection dropdown (enabled after selecting a database); Document textbox (optional JSON query, enabled after selecting a collection); a split button that reads Dump by default and, once a collection is selected, also exposes More Options with Update Document, Delete Document, Delete Collection, and Drop Database.
- etcd: Prefix textbox; Download button to download etcd data for the specified prefix.
- mTLS: Re-Attest button (disabled until at least one row is selected); Show filters / Search; a Gateway table with a selection checkbox per row (includes the Controller as a selectable row); a total count and Refresh button.
Actions
View Debugging Tools
View Debugging Tools
To view debugging tools:
- Go to Settings > Support > Debugging Tools.
- In the Tools list, select MongoDB, etcd, or mTLS.
Dump a MongoDB Collection
Dump a MongoDB Collection
To dump a MongoDB collection:
- Go to Settings > Support > Debugging Tools and select MongoDB.
- Select Database, then Collection. Optionally, enter a Document JSON query to filter the dump.
- Click Dump.
Parameter Details
MongoDB tool:| CoPilot Parameter Name | Description |
|---|---|
| Database | Select the MongoDB database. |
| Collection | Select the MongoDB collection (enabled after selecting a database). |
| Document | Enter an optional document filter in JSON format (enabled after selecting a collection). |
| Dump | Dump the selected database or collection. |
Modify or Delete MongoDB Data
Modify or Delete MongoDB Data
Warning: Update Document, Delete Document, Delete Collection,
and Drop Database make irreversible changes to Controller or CoPilot
data. Use these only when directed by Aviatrix Support.
- Go to Settings > Support > Debugging Tools and select MongoDB.
- Select Database and Collection (and, for a document-level action, enter a Document JSON query).
- Click the split button’s More Options arrow and select Update Document, Delete Document, Delete Collection, or Drop Database.
- Confirm the action.
Use etcd Debugging Tool
Use etcd Debugging Tool
To use the etcd tool:
- Go to Settings > Support > Debugging Tools and select etcd.
- Enter Prefix and click Download to download etcd data matching the prefix.
Use mTLS Debugging Tool
Use mTLS Debugging Tool
To use the mTLS tool:
- Go to Settings > Support > Debugging Tools and select mTLS.
- In the Gateway table, select the checkbox for the Controller and/or the gateways you want to re-attest. Use Show filters or Search to narrow the list.
- Click Re-Attest.
- Data Pipelines
- Logs
- Billing Report
- Doc IDs
- Upgrade Path Simulator
- Email Templates
Purpose
The Data Pipelines tab lets internal Aviatrix teams manually re-run CoPilot’s scheduled data-collection pipelines on demand, for troubleshooting. Use with Aviatrix Support when requested.Elements
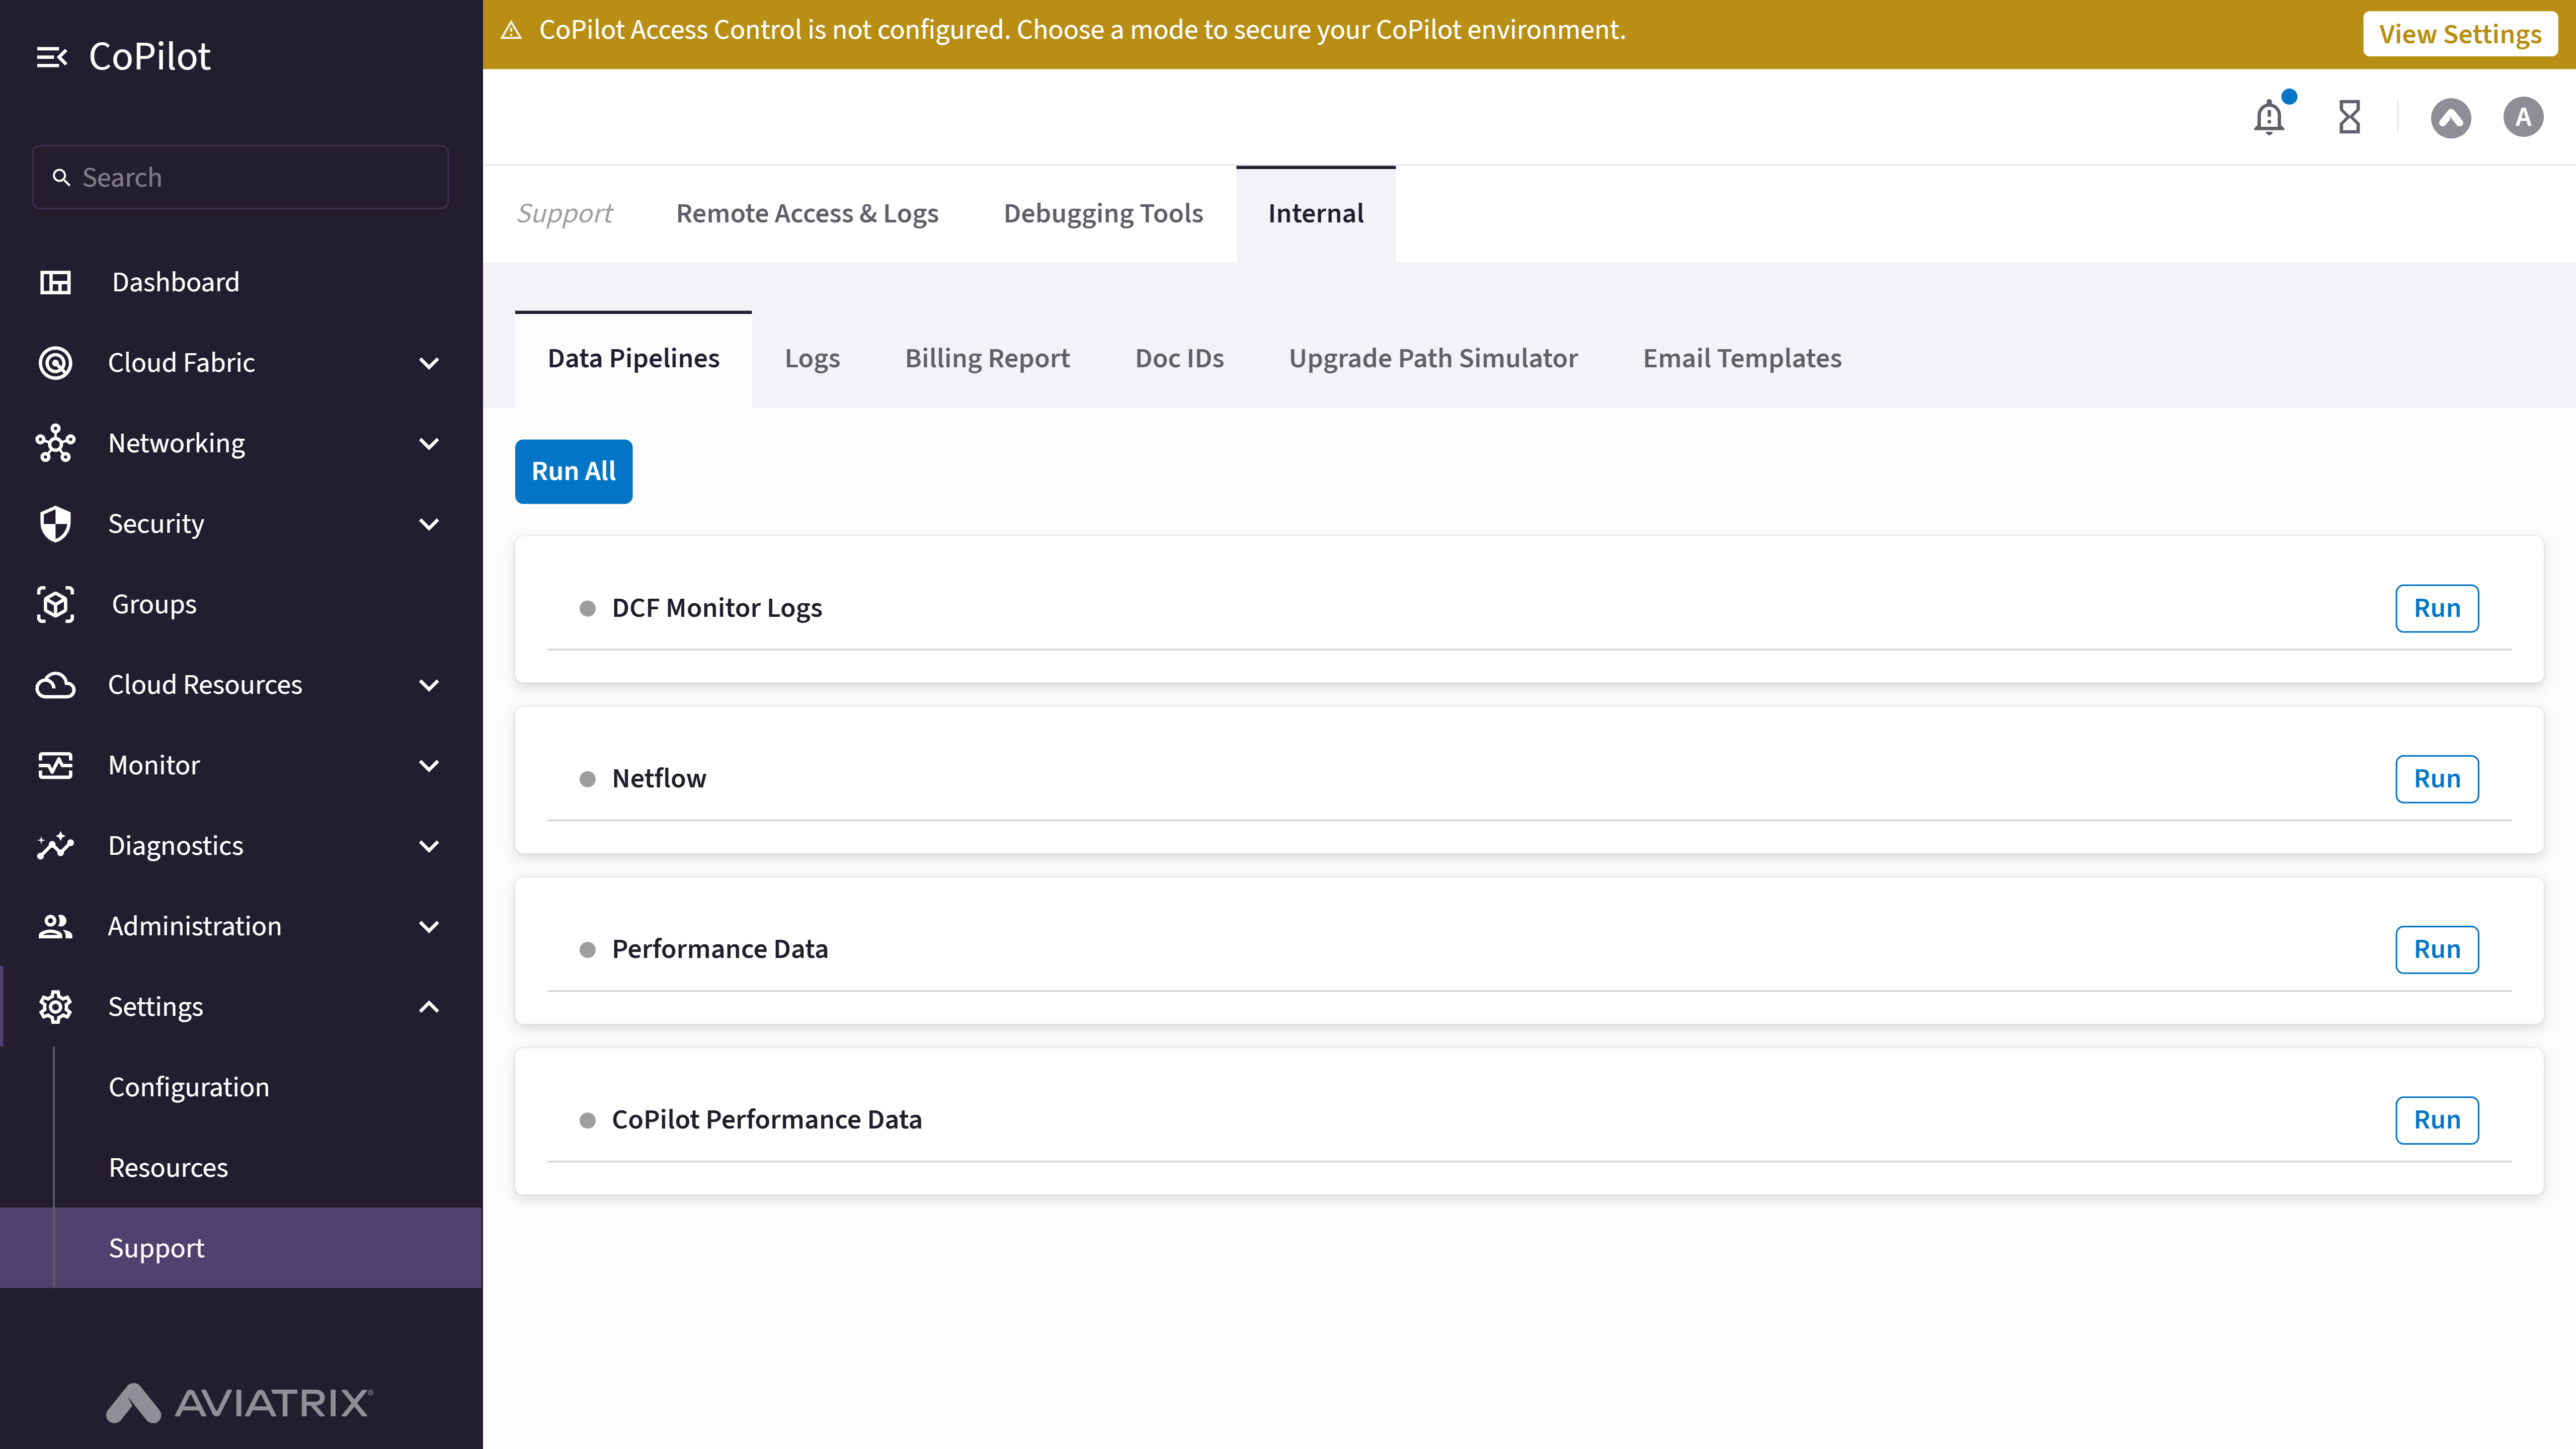
- Run All button: Runs every listed pipeline.
- Pipeline list: Each pipeline (for example, DCF Monitor Logs, Netflow, Performance Data, CoPilot Performance Data) has its own Run button.
Actions
Run a Data Pipeline
Run a Data Pipeline
To manually run a data pipeline:
- Go to Settings > Support > Internal > Data Pipelines.
- Click Run next to the pipeline you want to run, or click Run All to run every pipeline.
Purpose
The Logs tab provides an internal log viewer to open, display, and download log files from the CoPilot instance. Aviatrix gateways and Controller export log data; this viewer helps you inspect log content for troubleshooting. Use with Aviatrix Support when requested.Elements

- Select a log file: Combobox to select a log file from available log files.
- Open button: Opens the selected log file in the log viewer.
- Auto-scroll checkbox: Enables automatic scrolling to the bottom of the log as new content is added.
- Terminal Color checkbox: Enables terminal color formatting in the log viewer for readability.
- Wrap checkbox: Enables text wrapping for long lines in the log viewer.
- Clear button: Clears the log viewer content (disabled when no log is loaded).
- Download Logs button: Downloads the currently displayed log file.
- Log viewer: Displays the content of the selected log file.
Actions
View Logs
View Logs
To view log files using the Internal log viewer:
- Go to Settings > Support > Internal > Logs.
- In Select a log file, choose the log file you want to view.
- Click Open to load the log file in the log viewer.
- Optionally, enable Auto-scroll, Terminal Color, or Wrap to adjust how the log is displayed.
- Optionally, click Download Logs to download the current log file, or Clear to clear the viewer (when a log is loaded).
Parameter Details
| CoPilot Parameter Name | Description |
|---|---|
| Select a log file | Combobox to select a log file from available log files. |
| Open | Button to open and display the selected log file in the log viewer. |
| Auto-scroll | Checkbox to enable automatic scrolling to the bottom of the log as new content is added. |
| Terminal Color | Checkbox to enable terminal color formatting for better log readability. |
| Wrap | Checkbox to enable text wrapping for long lines in the log viewer. |
| Clear | Button to clear the log viewer content (disabled when no log is loaded). |
| Download Logs | Button to download the currently displayed log file. |
Purpose
The Billing Report tab lets internal Aviatrix teams point the Aviatrix Billing feature at a non-production Abup API endpoint or a specific Dev Controller ID, and view the billing task’s run status. Use with Aviatrix Support when requested.Elements

- Billing Report Abup URL: Abup URL field and Update Task Server button; a table showing the current API Server and Task Server values.
- Billing Report Dev Controller ID: Dev Controller ID field and Update Task Server button; a table showing the current API Server and Task Server values.
- Billing Task Status: Table listing each billing task by Name and whether it Is Running.
Actions
View Billing Report Configuration
View Billing Report Configuration
To view the internal billing report configuration:
- Go to Settings > Support > Internal > Billing Report.
- Review the current Abup URL and Dev Controller ID values (API Server and Task Server), and the Billing Task Status table.
Update the Abup URL or Dev Controller ID
Update the Abup URL or Dev Controller ID
Warning: Updating the ID in the Task Server clears and rebuilds all
cached billing data in the database, which can take a long time.
- Go to Settings > Support > Internal > Billing Report.
- Enter the new value in Abup URL or Dev Controller ID.
- Click Update Task Server.
- Check the Billing Task Status table to confirm the data has finished reloading.
Purpose
The Doc IDs tab provides an internal viewer for CoPilot’s inline help system. Each in-app help link (help-*) maps to an AsciiDoc (.adoc) source
page and, in most cases, the UI component that surfaces it; use this tab with
Aviatrix Support to confirm a help ID’s source content, check whether an ID is
still wired up to the UI, or preview how a help doc renders inline.Elements

- Inline Doc IDs Viewer heading: All / Used / Unused filter buttons, each showing a count (for example, All 240, Used 136, Unused 104). Used IDs have a mapped UI component; Unused IDs have a Doc mapping but no UI component reference found.
- Search: Filters the ID list by ID name.
- ID list: Each entry shows the help ID (for example,
help-about-externalgroups), its Doc path (.adocfile, relative to the docs source root), and, for Used IDs, its UI path (the.tsxcomponent file that references the ID). Selecting an entry loads the rendered content of that ID’s.adocpage in the panel to the right.
Actions
View or Filter Doc IDs
View or Filter Doc IDs
To view or filter document IDs:
- Go to Settings > Support > Internal > Doc IDs.
- Click All, Used, or Unused to filter the ID list, or use Search to find a specific ID.
Preview a Doc ID's Rendered Content
Preview a Doc ID's Rendered Content
To preview how a help ID’s documentation renders:
- Go to Settings > Support > Internal > Doc IDs.
- In the ID list, click the ID you want to preview.
.adoc page appears to the right of the list.Purpose
The Upgrade Path Simulator tab lets internal Aviatrix teams simulate the Controller and gateway upgrade path for any Controller/gateway version combination, without needing a live environment on those versions. Use with Aviatrix Support to reproduce or explain a customer’s upgrade path.Elements
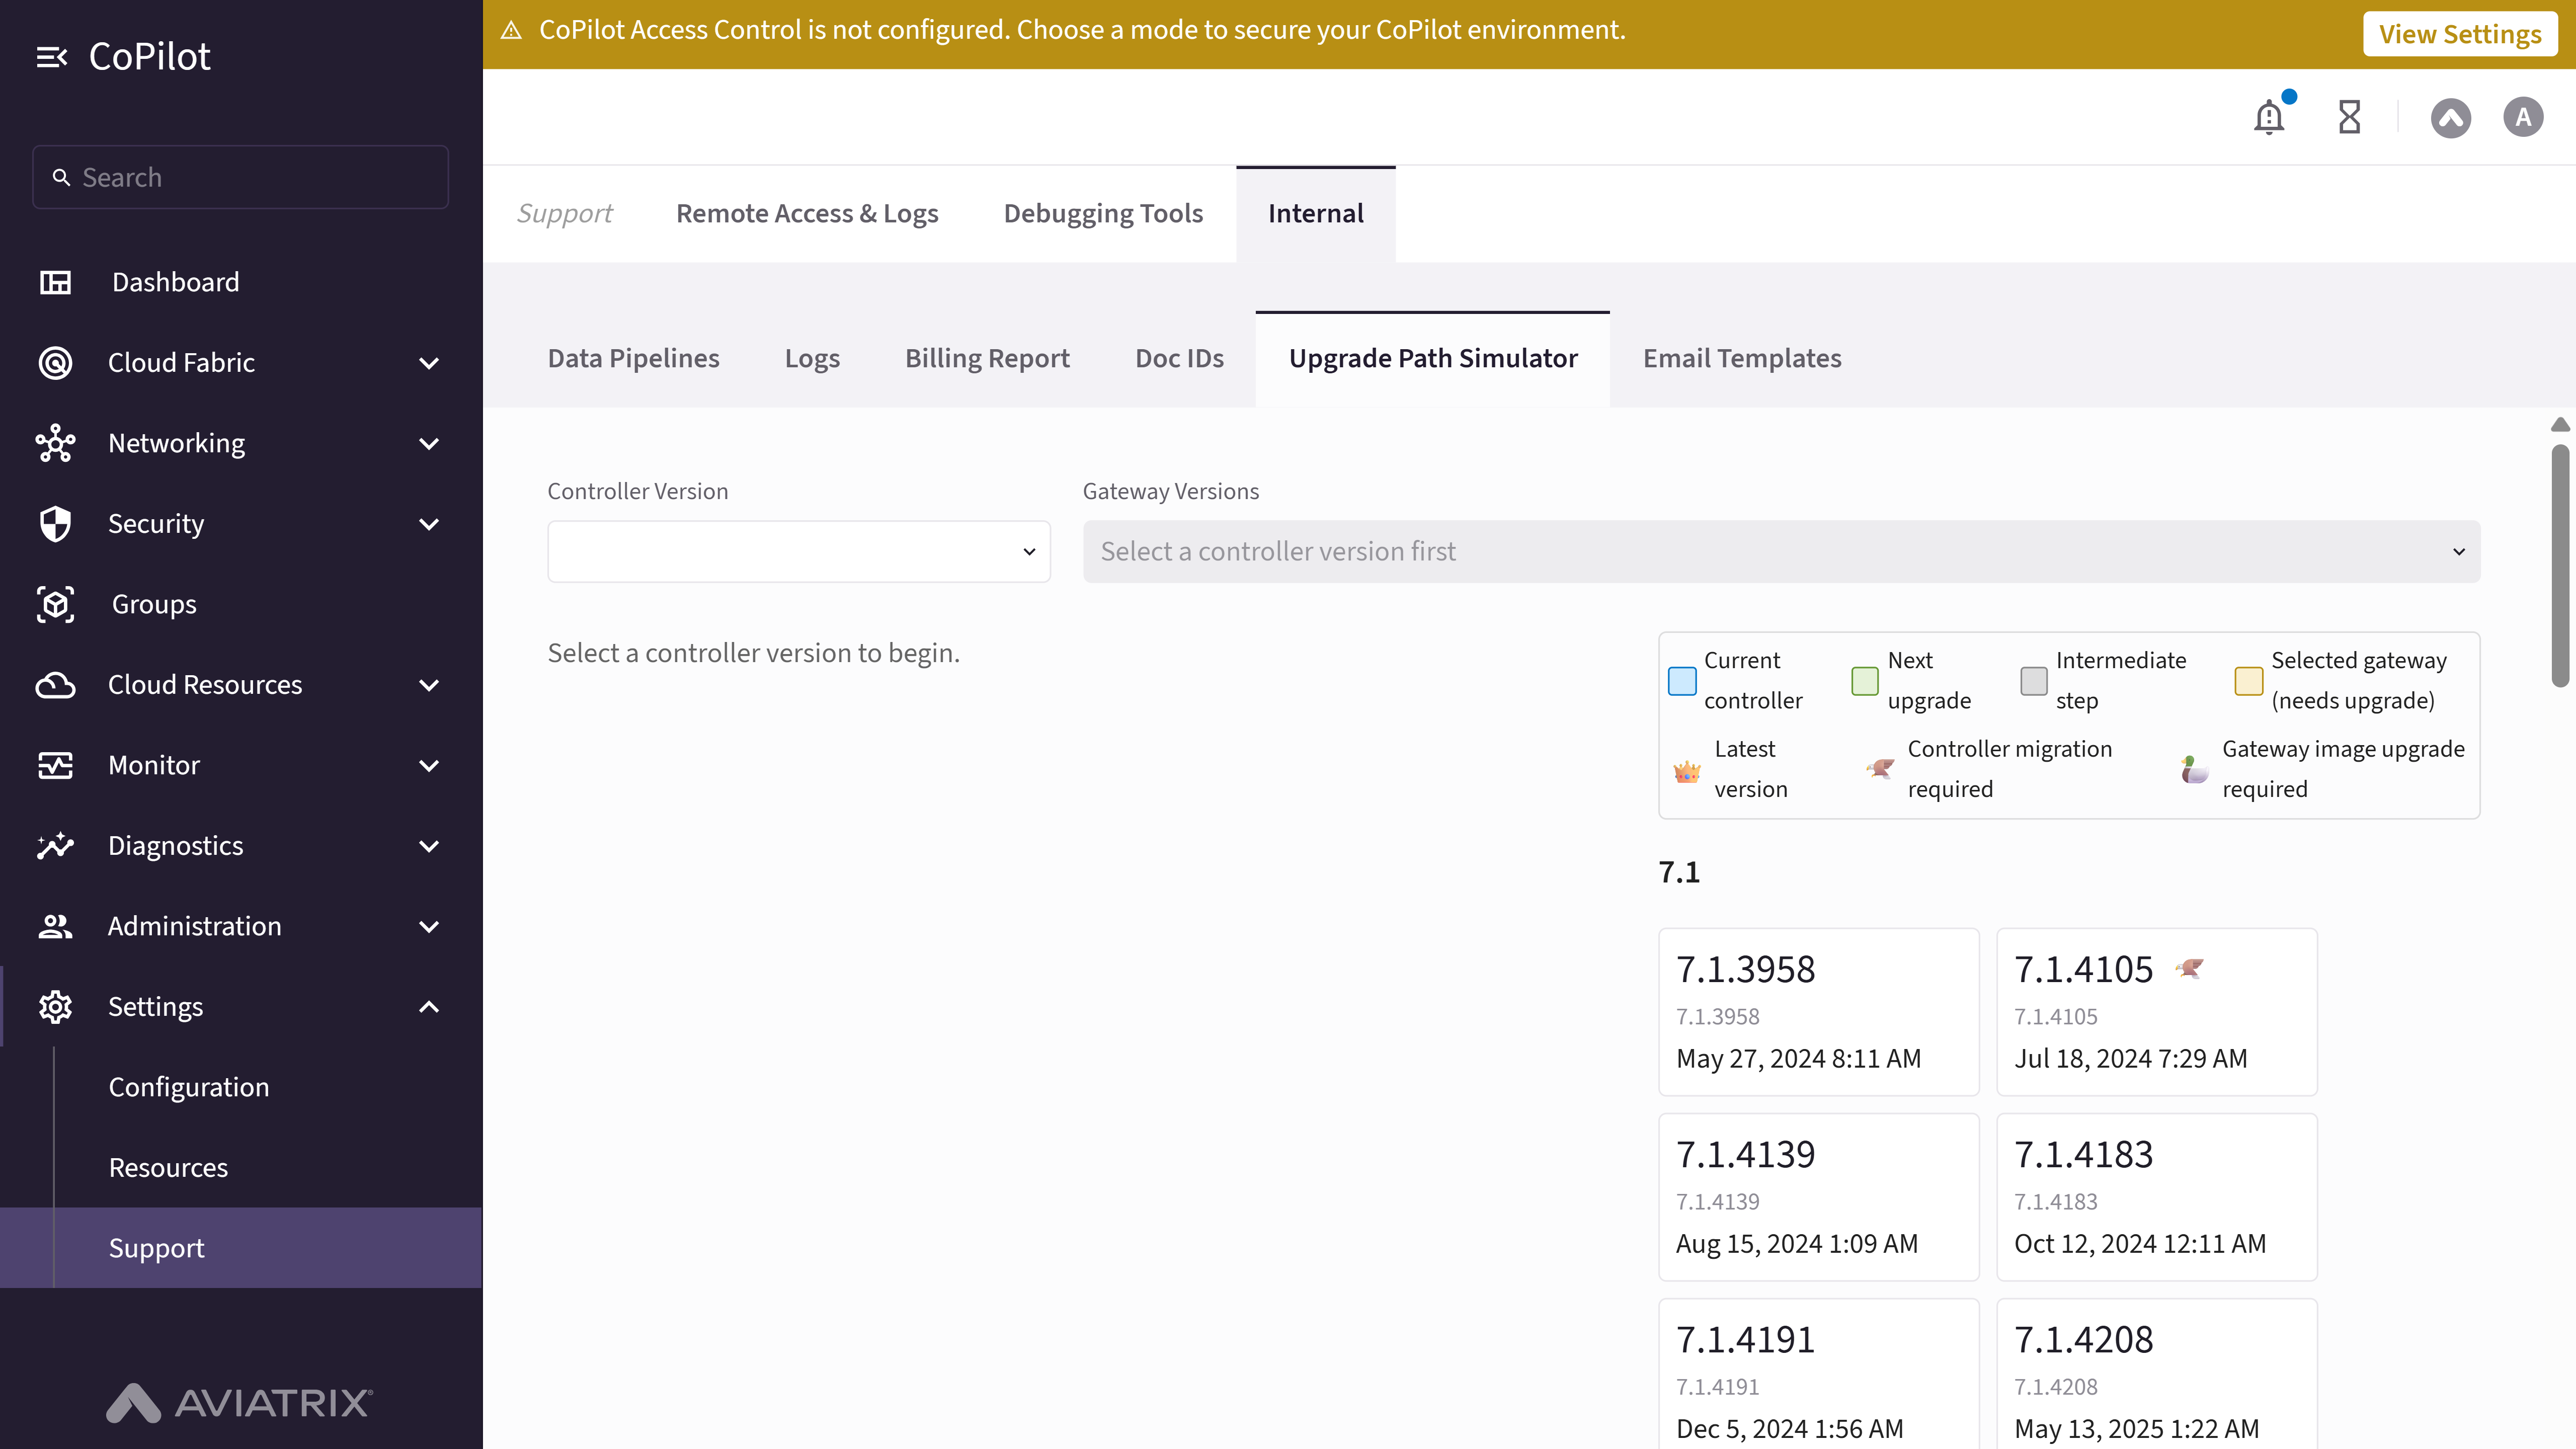
- Controller Version: Combobox to select a hypothetical Controller version.
- Gateway Versions: Combobox (enabled after selecting a Controller version) to select one or more hypothetical gateway versions to simulate; options are limited to versions at or below the selected Controller version. Includes a Select All option.
- Version timeline: Version history grouped by minor release (for example, 7.1, 7.2, 8.0 … 10.1), each patch version showing its build number and release date, and marked with an icon where applicable: 👑 Latest version, 🦅 Controller migration required, 🦆 Gateway image upgrade required. Once a Controller and at least one gateway version are selected, the timeline also highlights the Current controller, Next upgrade, Intermediate step, and Selected gateway (needs upgrade) entries.
- Upgrade path summary: Once a Controller and gateway version are selected, shows the selected Controller/Gateways versions, an Upgrade Controller to <version> (Software Upgrade) step, an Upgrade All Gateways to <version> (Image Upgrade) step, the Target Version, a count of remaining intermediate versions, and the Latest Version.
Actions
Simulate an Upgrade Path
Simulate an Upgrade Path
To simulate an upgrade path:
- Go to Settings > Support > Internal > Upgrade Path Simulator.
- Select a Controller Version.
- In Gateway Versions, select one or more gateway versions (or Select All).
Purpose
The Email Templates tab lets internal Aviatrix teams preview the content of CoPilot’s system-generated email notifications and send a test copy to a recipient. Use with Aviatrix Support to verify template wording or troubleshoot a customer-reported notification email.Elements
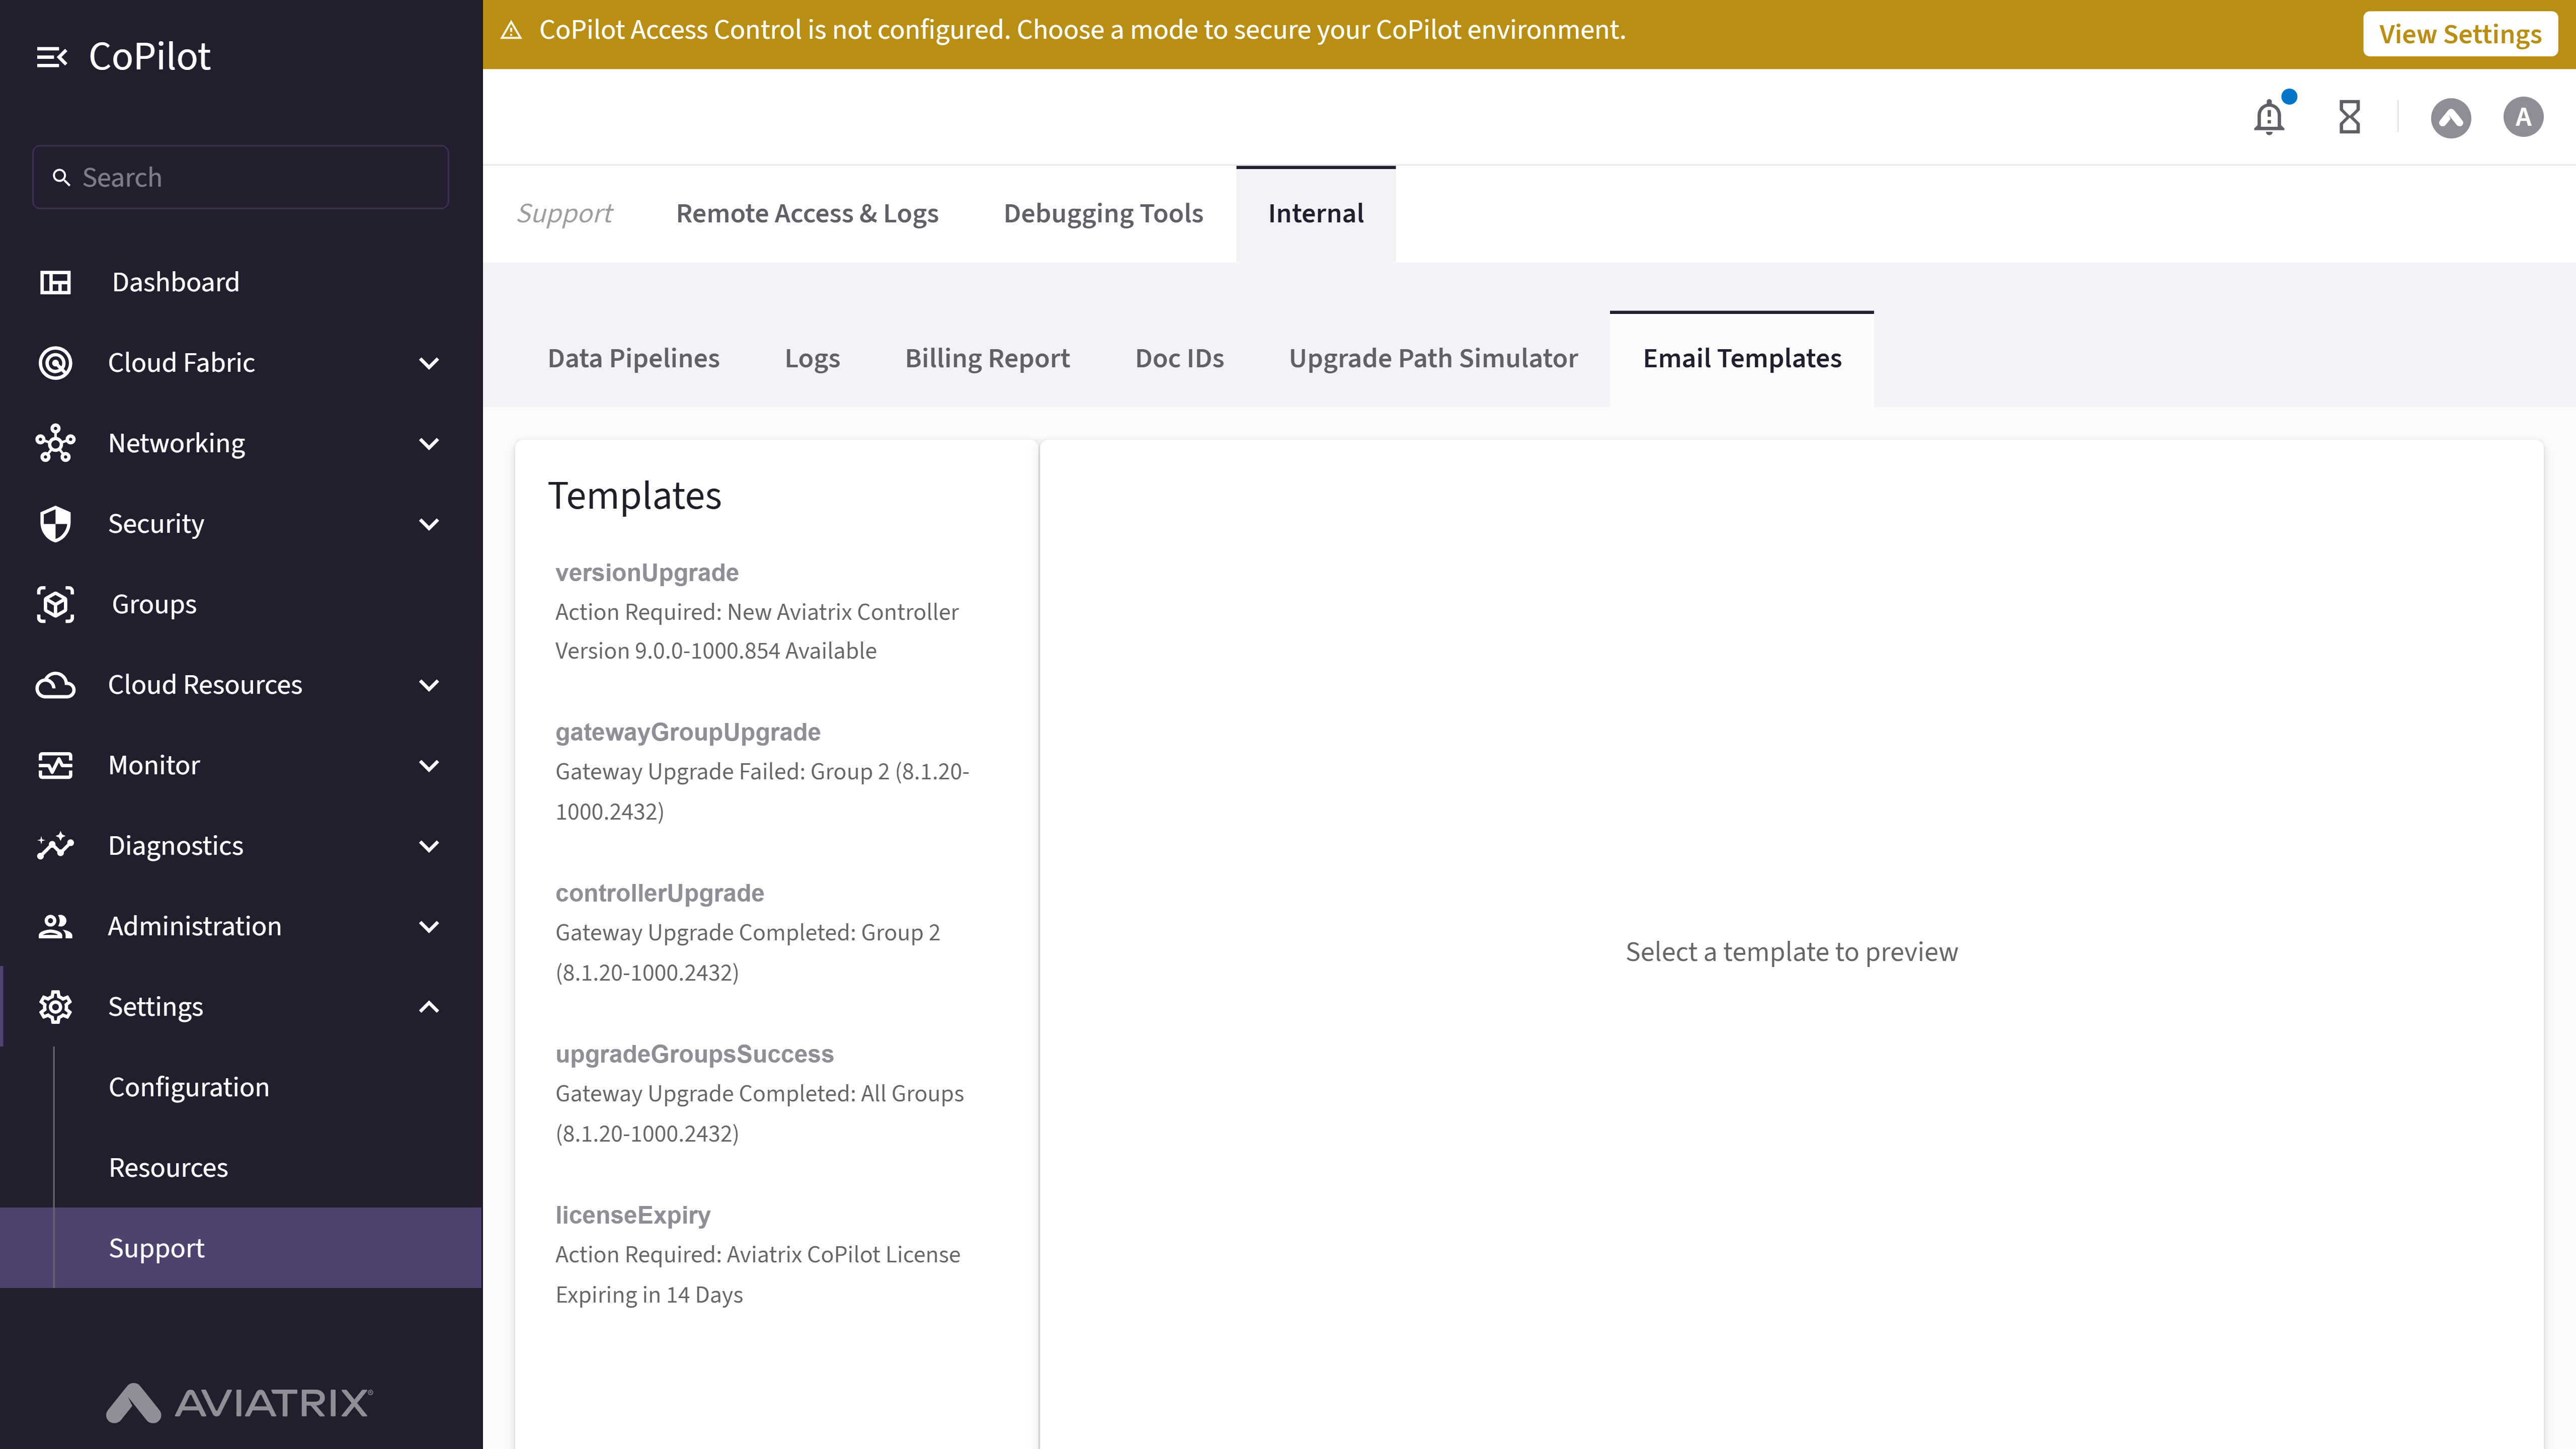
- Templates list: Each template shows its template ID (for example,
versionUpgrade,gatewayGroupUpgrade,controllerUpgrade,upgradeGroupsSuccess,licenseExpiry) and its email subject line. - Recipient email address field / Send button: Enter an email address and click Send (enabled once an address is entered) to send a test copy of the selected template.
- Preview panel: Shows the selected template’s Subject and From address, followed by a rendered preview of the email body.
Actions
Preview an Email Template
Preview an Email Template
To preview an email template:
- Go to Settings > Support > Internal > Email Templates.
- In the Templates list, click the template you want to preview.
Send a Test Email
Send a Test Email
To send a test copy of a template:
- Go to Settings > Support > Internal > Email Templates.
- Select a template from the Templates list.
- Enter a Recipient email address and click Send.