- System Health
- Disk Utilization
- Index Management
- Task Server
Purpose
The System Health page monitors system health metrics for Controller and CoPilot (system health) or Controller only (network health), views overall health status, services status, alerts, and creates alert configurations.Elements
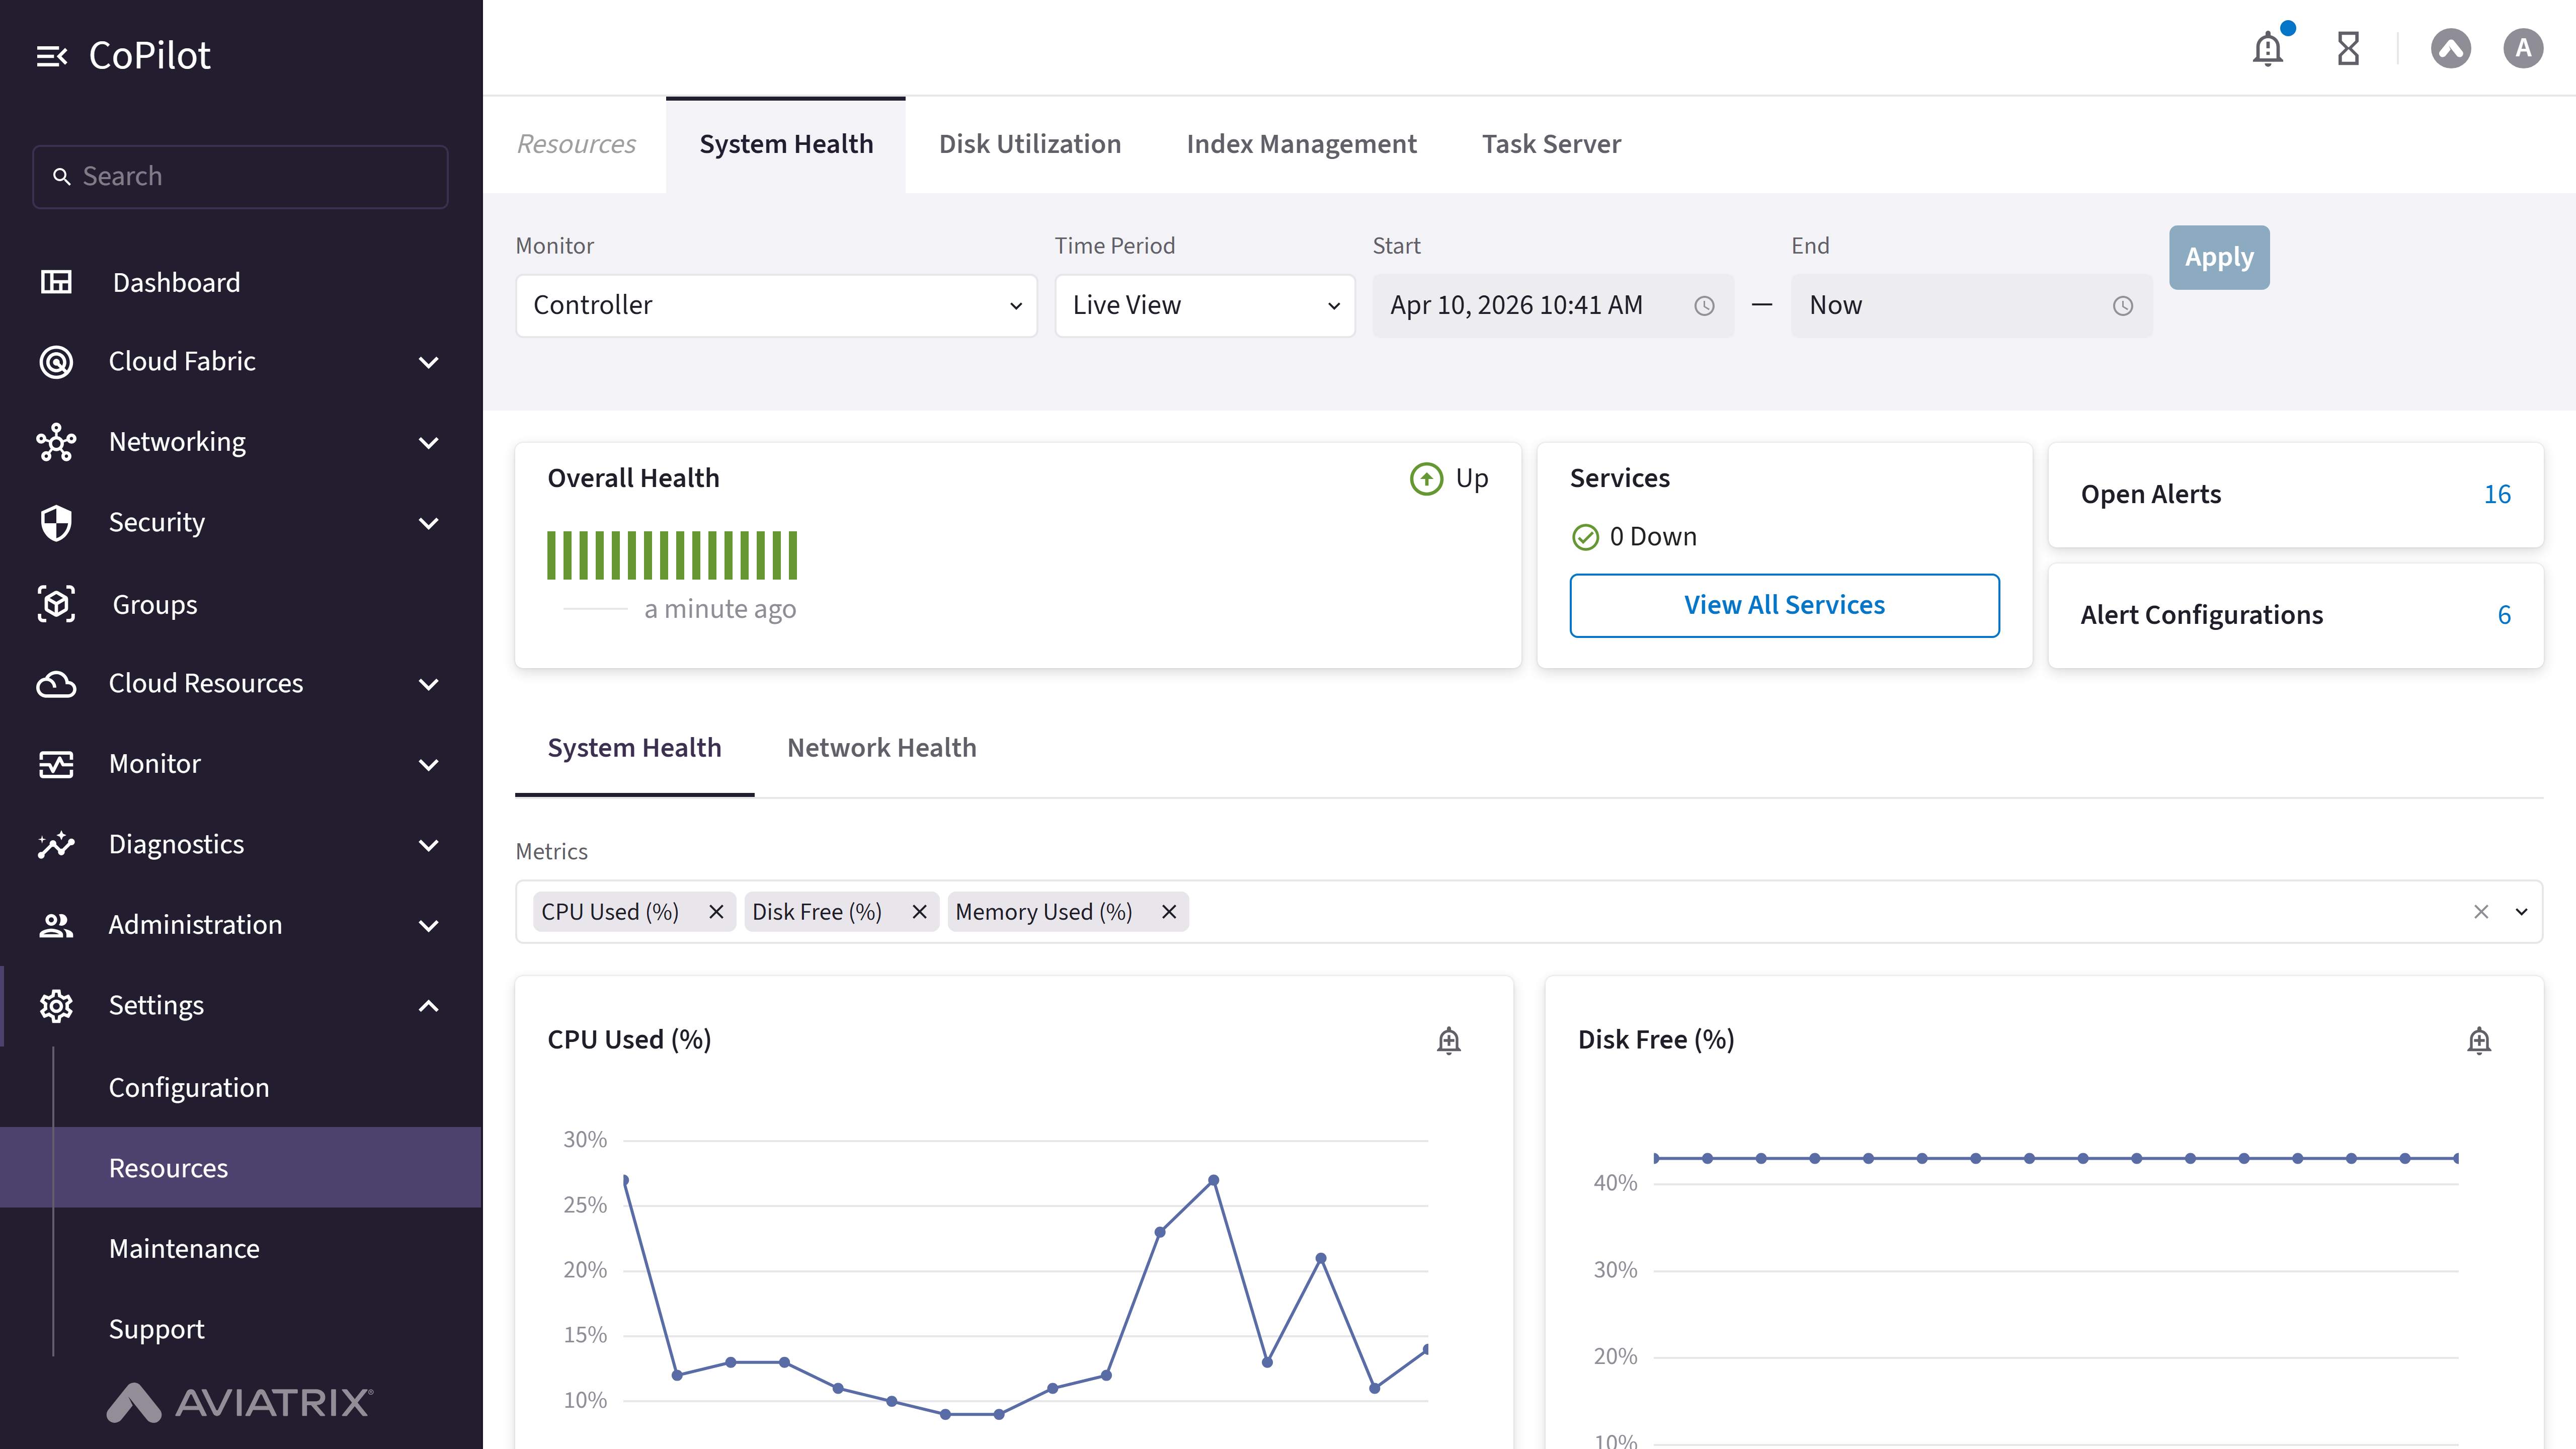
- Monitor: Dropdown to select the monitored system (Controller or CoPilot, each listed with its IP address).
- Time Period: Dropdown to select the time period (Live View, Last Hour, etc.). Selecting a custom range enables Start and End.
- Start / End: Text fields for the custom time period’s start and end date and time (enabled only when Time Period is set to a custom range).
- Apply button: Applies the selected time period filters.
- Overall Health: Card showing the overall health status (Up, Degraded, or Down) and how long ago it was last checked; for Controller, also shows an uptime percentage.
- Services: Heading with a View All Services button that opens a dialog listing every underlying service for the selected monitor.
- Open Alerts / Alert Configurations: Counts of currently open alerts and configured alert rules; each count is a link to the alerts page.
- System Health / Network Health: Sub-tabs under the health cards. Network Health only appears when Monitor is set to Controller (CoPilot has no network health view).
- Metrics: Multiselect dropdown for selecting which metric charts to show. Options differ by sub-tab: System Health offers CPU Used (%), Disk Free (%), and Memory Used (%); Network Health offers Received Rate (PPS), Transmitted Rate (PPS), and Total Rate.
- Create Alert button: Appears on each metric’s chart; opens a dialog to create an alert configuration for that specific metric.
Actions
View System Health
View System Health
To view system health:
- Go to Settings > Resources > System Health.
- Select Monitor (Controller or CoPilot), set Time Period or Start/End, and click Apply. Review Overall Health, Services, Open Alerts, and Alert Configurations.
- Under the System Health sub-tab, use Metrics to choose which charts to display, and review each metric’s chart.
Parameter Details
View Network Health
View Network Health
To view network health (Controller only):
- Go to Settings > Resources > System Health and set Monitor to Controller.
- Click the Network Health sub-tab (only available for Controller).
- Set Time Period or Start/End and click Apply. Use Metrics to choose which charts to display (Received Rate (PPS), Transmitted Rate (PPS), Total Rate).
View All Services
View All Services
To view the status of all underlying services for a monitor:
- Go to Settings > Resources > System Health.
- Next to Services, click View All Services.
- The dialog lists each service by name with its status (Up or Down), the total service count, and when the list was last refreshed. Click Close to dismiss the dialog.
Create a Metric Alert
Create a Metric Alert
To create an alert for a specific health metric:A new alert configuration is created for the selected metric.
- Go to Settings > Resources > System Health.
- On the chart for the metric you want to alert on (for example, CPU Used (%)), click Create Alert.
- In the Create Alert Configuration dialog, enter a Name, choose Condition (Matches All or Matches Any), set the condition’s threshold, and set the Evaluation Period (in minutes). Under Send Alerts To, select the Recipients. Click Save.
Note: Minimum Count of Matching Entities is shown but disabled for
Controller and CoPilot health alerts — Controller and CoPilot alerts do not
support modifying this field.