

Purpose
The Anomaly Detection page provides real-time visibility into unusual patterns, deviations, and potential security threats across cloud environments. It leverages advanced anomaly detection algorithms and integrates IDS/IPS capabilities for proactive monitoring and operational resilience. The Anomaly Detection page monitors selected VPC/VNets for unusual behavioral patterns in network traffic. CoPilot learns baseline traffic behavior over a configurable learning period, then raises anomalies when metrics deviate significantly from that baseline. Anomalies are categorized by severity (Low, Medium, or High) and can trigger alerts to configured notification channels.Elements
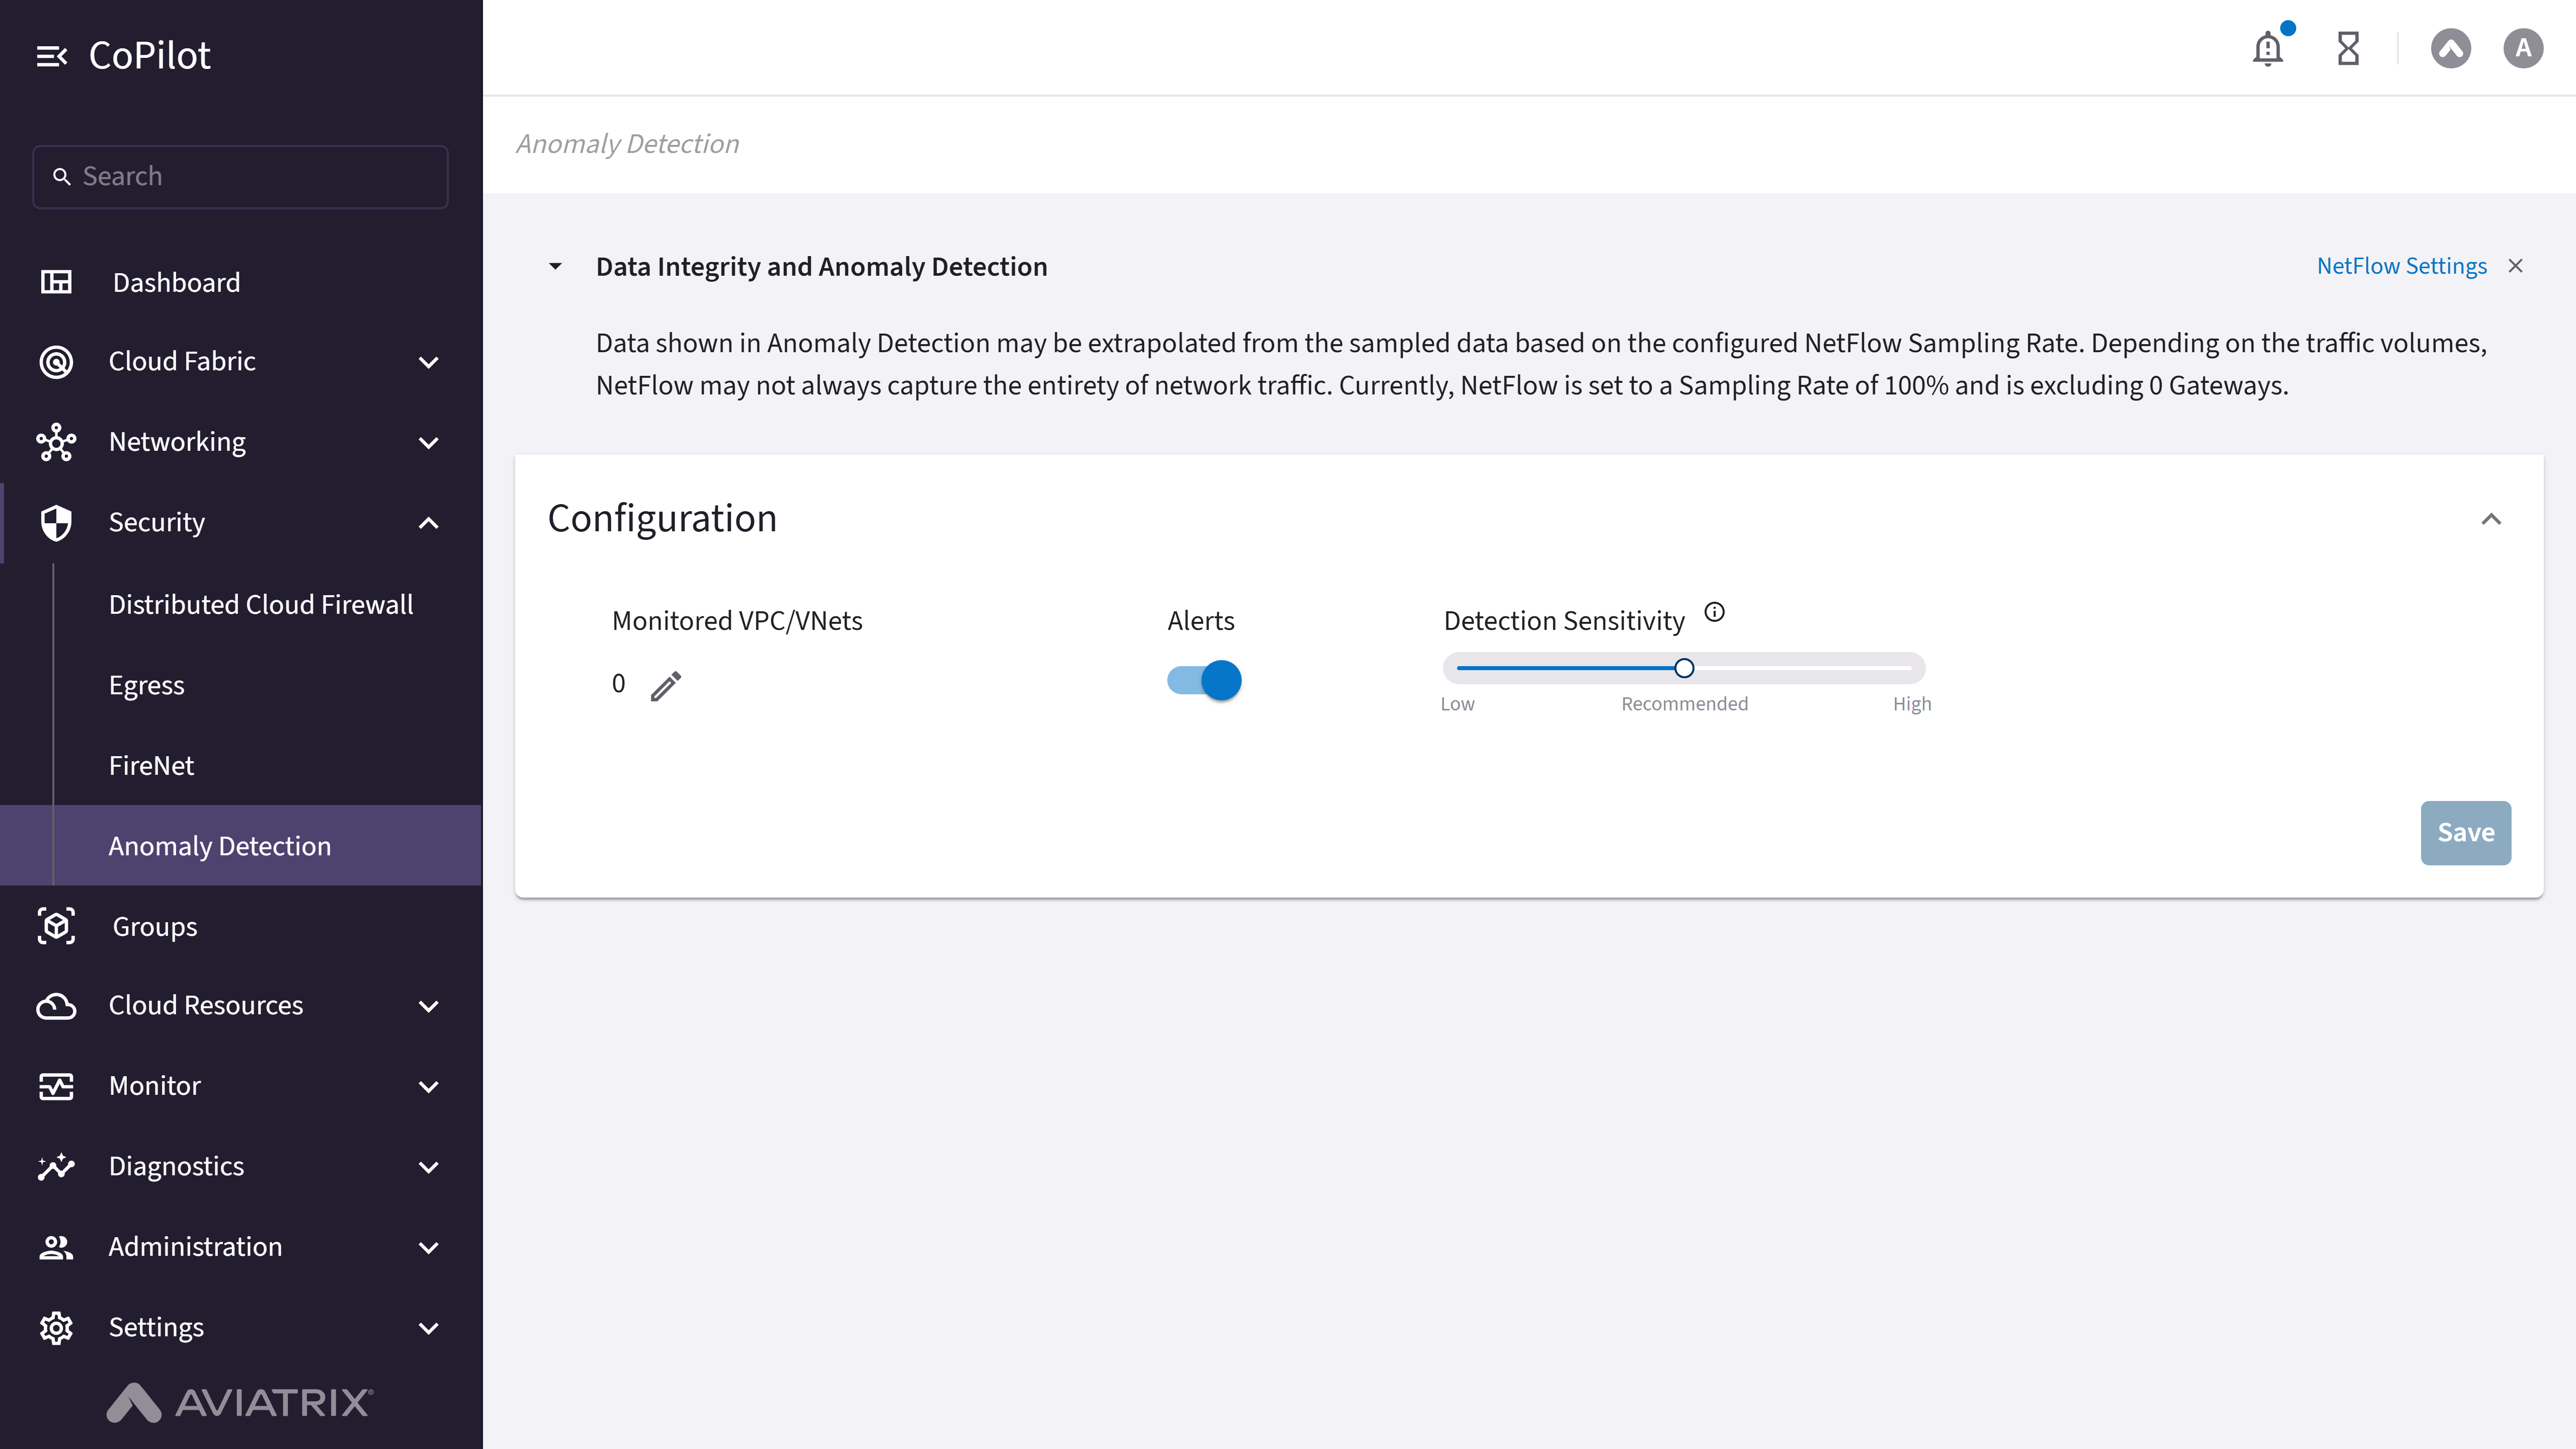
- Data Integrity and Anomaly Detection panel — dismissible banner noting that anomaly data may be extrapolated from the sampled data based on the configured NetFlow Sampling Rate, with a NetFlow Settings link.
- Configuration — set the monitored VPC/VNets, detection sensitivity, and alert settings.
- Dashboard — view anomaly data for the selected time range. The dashboard appears only after at least one monitored VPC/VNet completes its learning period.
- Monitored VPC/VNets: Shows the count of VPC/VNets currently configured for anomaly detection.
- Edit icon: Opens the Manage Monitored VPC/VNets dialog to add or remove VPC/VNets and configure the learning period.
- List icon: Opens the Learning Status dialog to review the learning and detection status of each VPC/VNet.
X in Learning Phasechip: Appears whenXnumber of VPC/VNets are still in the learning phase. Click the chip to open the Learning Status dialog.- Alerts toggle: Enables or disables anomaly alert notifications. Turning on the toggle opens a channel selection dialog.
- Detection Sensitivity slider: Sets how aggressively CoPilot flags deviations. Marks: Low (1), Recommended (3), High (5).
- Save button: Saves the configuration. Disabled when there are no pending changes. An Unsaved Changes chip appears when unsaved changes are present.
- Date range picker: Filters the dashboard by time period. Options: Last 60 Minutes, Last 24 Hours, Last 7 Days (default), Last 30 Days.
- Total Anomalies card: Total anomaly count for the selected period.
- VPC/VNets with Anomalies card: Number of VPC/VNets that had at least one anomaly.
- Metrics causing Anomalies card: Number of distinct traffic metrics that triggered anomalies.
- Anomalies by Severity chart: Donut chart showing anomaly counts at Low, Medium, and High severity.
- Anomalies by VPC/VNet chart: Donut chart showing anomaly counts per VPC/VNet.
- Anomalies by Top Metric chart: Donut chart showing which traffic metrics triggered the most anomalies.
- Anomalies Over Time chart: Line chart showing anomaly counts over the selected period.
- Total Anomalies (Cumulative) chart: Line chart showing the running total of anomalies over the selected period.
- Anomaly table: Lists all anomaly events in the selected time range.
Actions
View Anomalies
View Anomalies
Before viewing anomalies, ensure at least one monitored VPC/VNet has completed
its learning period.To view anomalies:
- Go to Security > Anomaly Detection.
- Set the time range using the date range picker.
- Clic Apply.
- Review the summary cards.
- Inspect the charts.
- Investigate individual anomalies.
- Optionally, mark false positives by toggling the Anomaly switch for any row.
Parameter Details
View Anomaly Details
View Anomaly Details
To view the details of a specific anomaly:
- Go to Security > Anomaly Detection.
- In the anomaly table, click the Detected At timestamp link for the event.
Configure Anomaly Detection
Configure Anomaly Detection
Before configuring anomaly detection, ensure you have
all_write or
all_security_write permissions in CoPilot.To configure anomaly detection:- Go to Security > Anomaly Detection.
- In the Configuration section, click the edit icon next to Monitored
VPC/VNets.
The Manage Monitored VPC/VNets dialog appears. - In the Manage Monitored VPC/VNets dialog, move VPC/VNets to the Monitored list.
- Set the Learning Period (in weeks; minimum 2, maximum 52).
- Click Save.
- Adjust the Detection Sensitivity slider to Low, Recommended, or High based on your environment’s tolerance for alert volume.
- Turn on the Alerts toggle. Select the notification channels in the dialog that appears.
- Click Save.
VPC/VNets in the learning phase do not produce anomaly data. The dashboard
becomes visible only after the learning period ends for at least one monitored
VPC/VNet. View learning status for each VPC/VNet by clicking thelist icon next
to Monitored VPC/VNets.
Check Learning Status
Check Learning Status
To check learning status:
- Go to Security > Anomaly Detection.
- In the Configuration section, click the list icon next to Monitored VPC/VNets.
The Learning Status dialog appears. - Review the learning and detection status of each VPC/VNet.
Detection for a VPC/VNet becomes Active after its learning end time
passes. VPC/VNets still in the learning phase show Pending with the
expected completion date.