Gateway Size Distribution
The following data represents the real-world distribution of Transit Gateway sizes across the Aviatrix customer base. The data is a representation of what Aviatrix customers are using in their own production deployments and will not necessarily reflect the best practice and choice for your network. Transit Gateways are larger in size because it serves as the hub of hub-and-spoke architecture, terminating multiple Spoke Gateways. That means that Transit Gateways need more IPsec throughput and performance compared to Spoke Gateways, which service only one VPC/VNET/VCN of workloads. The following tables show data for AWS and Azure cloud.Transit Gateway
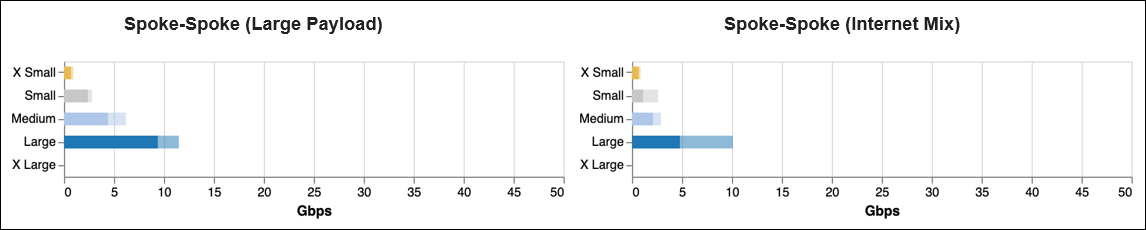
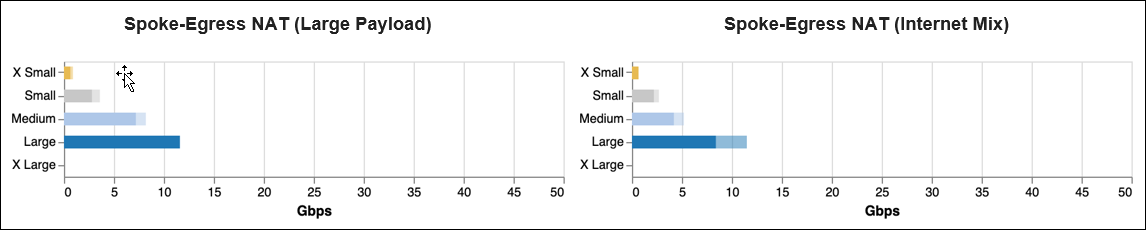
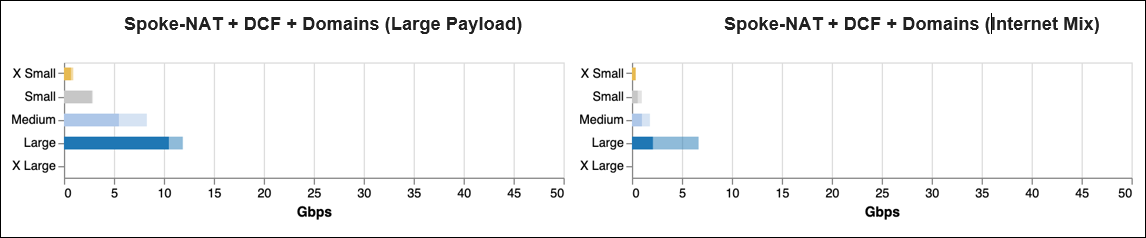
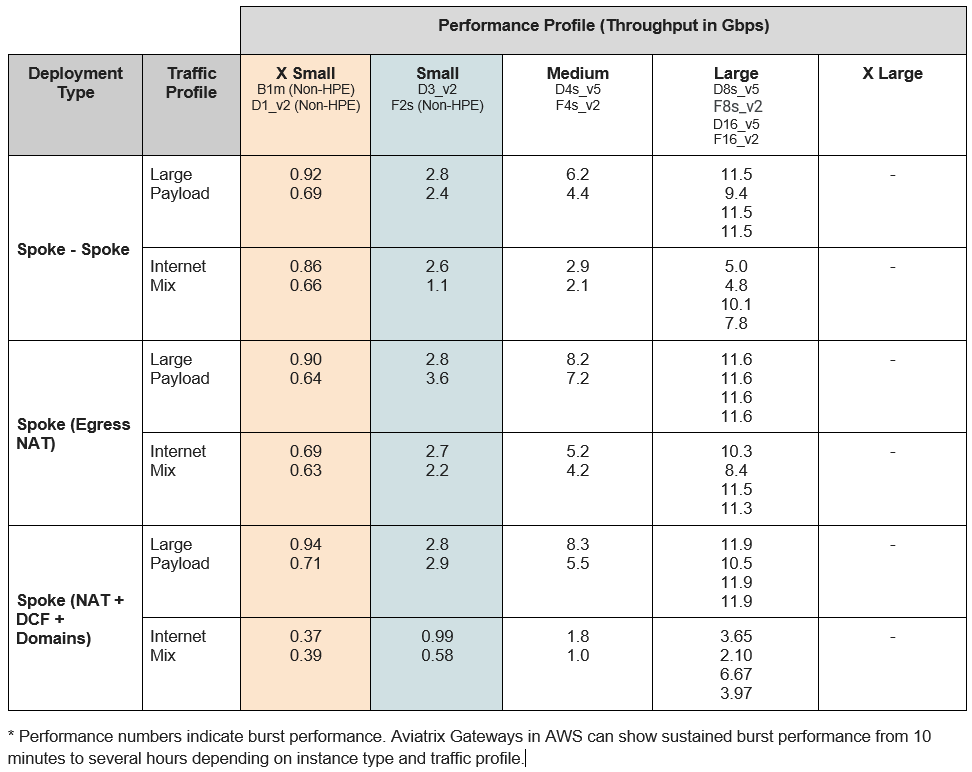
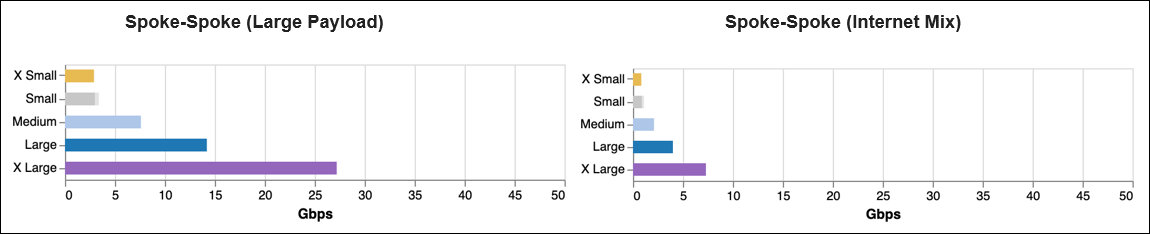
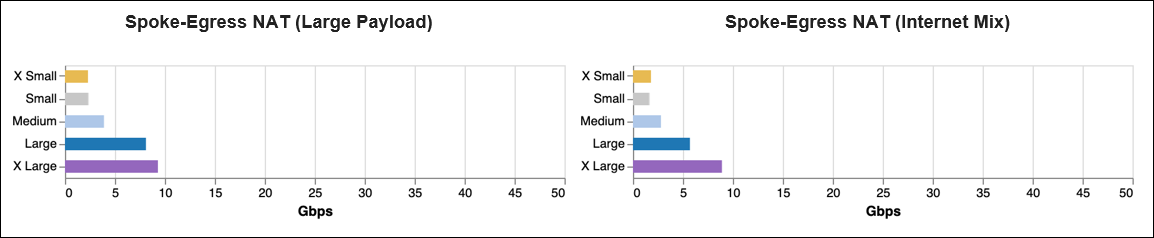
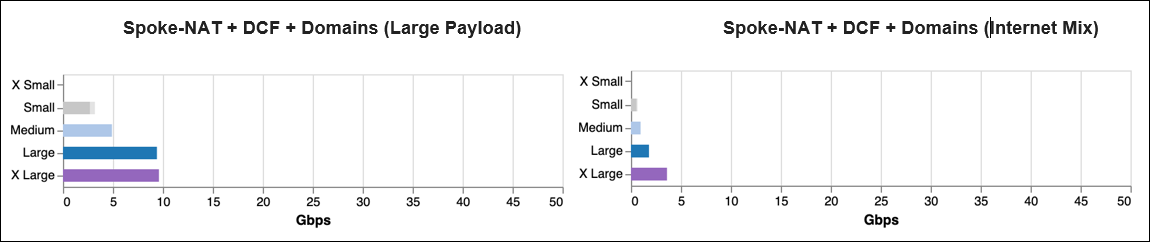
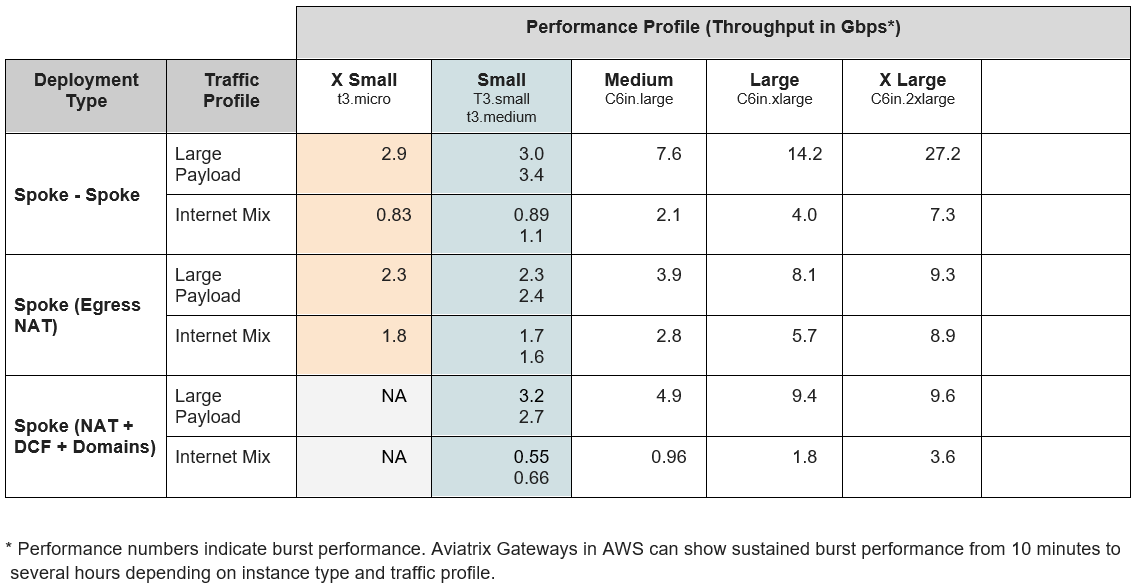
Spoke Gateway

Bandwidth and Performance
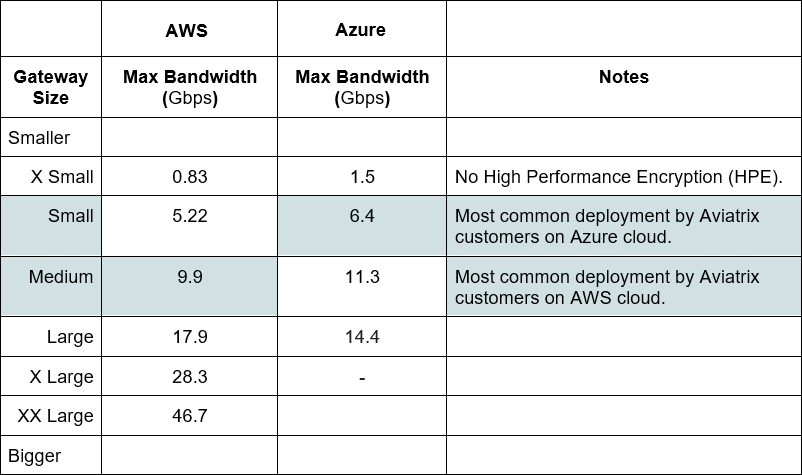
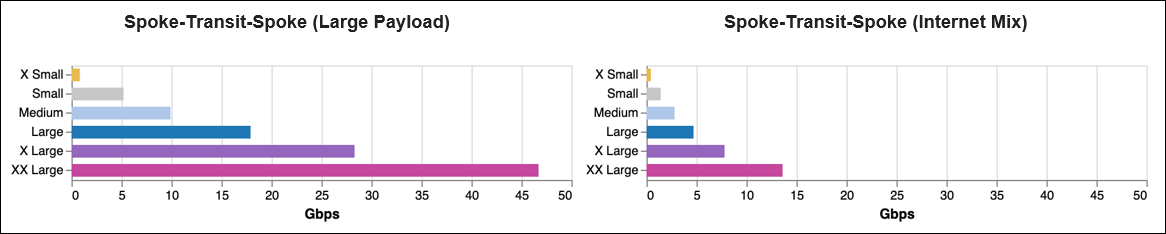
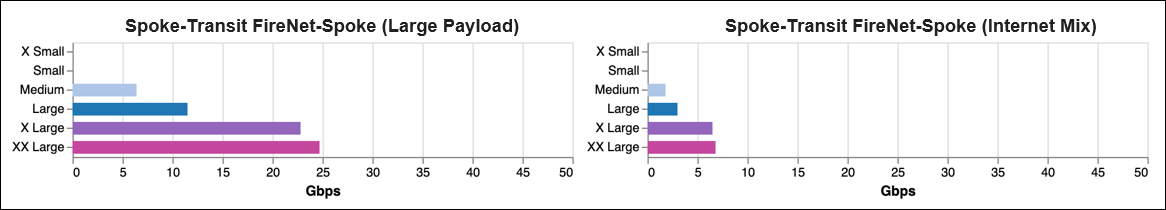
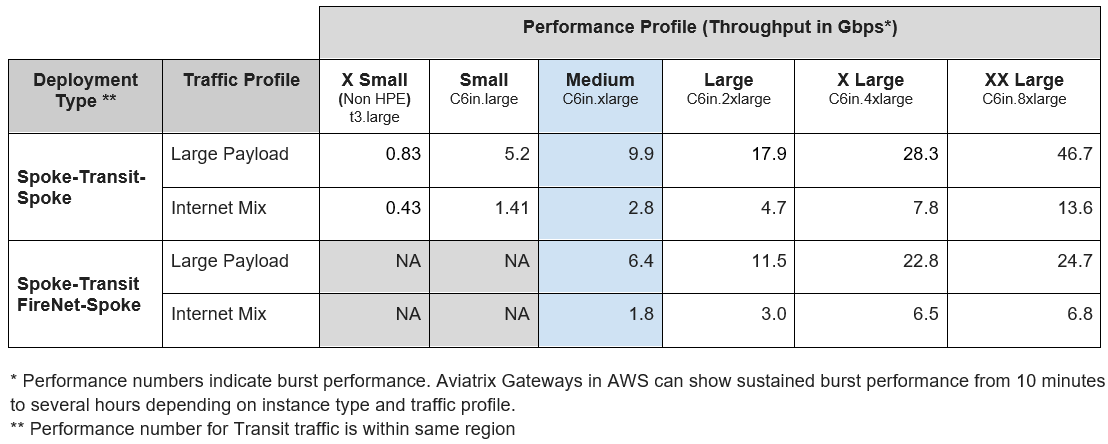
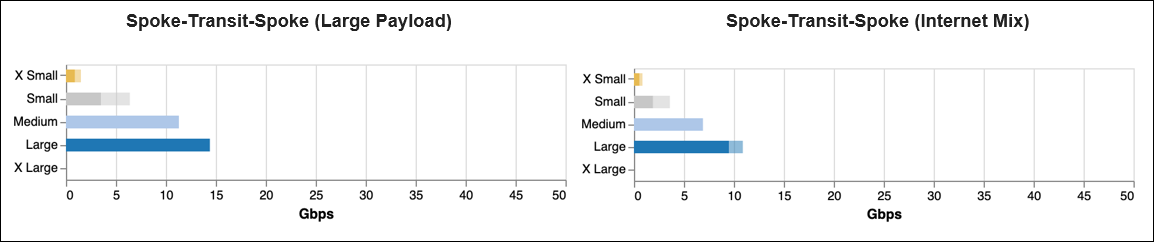
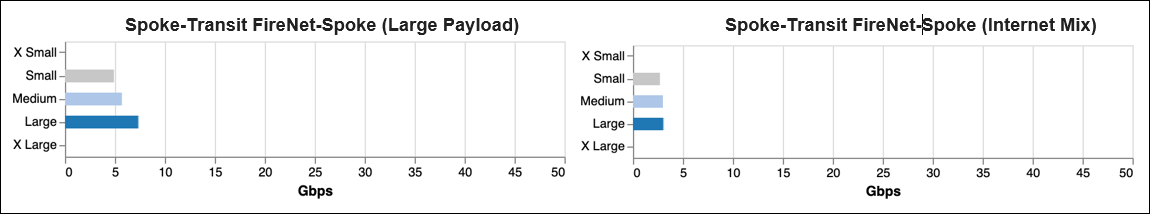
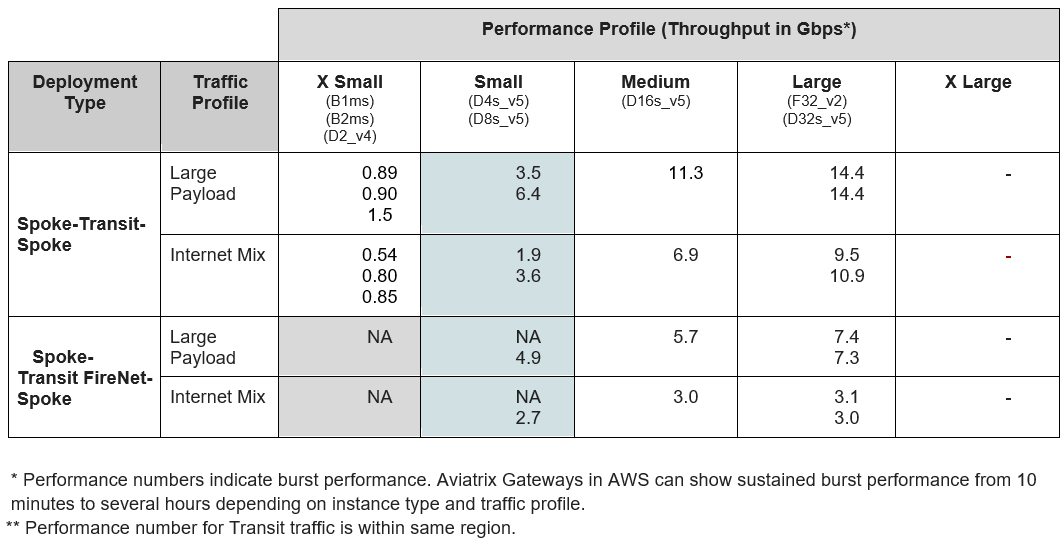
This section focuses on the bandwidth and performance expectations of Transit and Spoke Gateways based on their size. All the performance numbers are based on Gateways with High Performance Encryption (HPE) unless specified otherwise.Gateway performance is impacted by packet size. In our internal testing, a best-case large payload number (which most vendors use) and an Internet Mix (iMix) number of varying packet sizes was used to reflect more real-world performance numbers.
AWS Traffic and Deployments
Transit Gateway
Spoke Gateway
Azure Traffic and Deployments
Transit Gateway
Spoke Gateway