

- Dashboard
- Policies
- Monitor
- Audit
- IPS
- TLS
- Settings
- Overview
- Security Control
Purpose
The Overview sub-tab provides a summary of threat activity, egress traffic, and firewall coverage detected by the Distributed Cloud Firewall.Elements
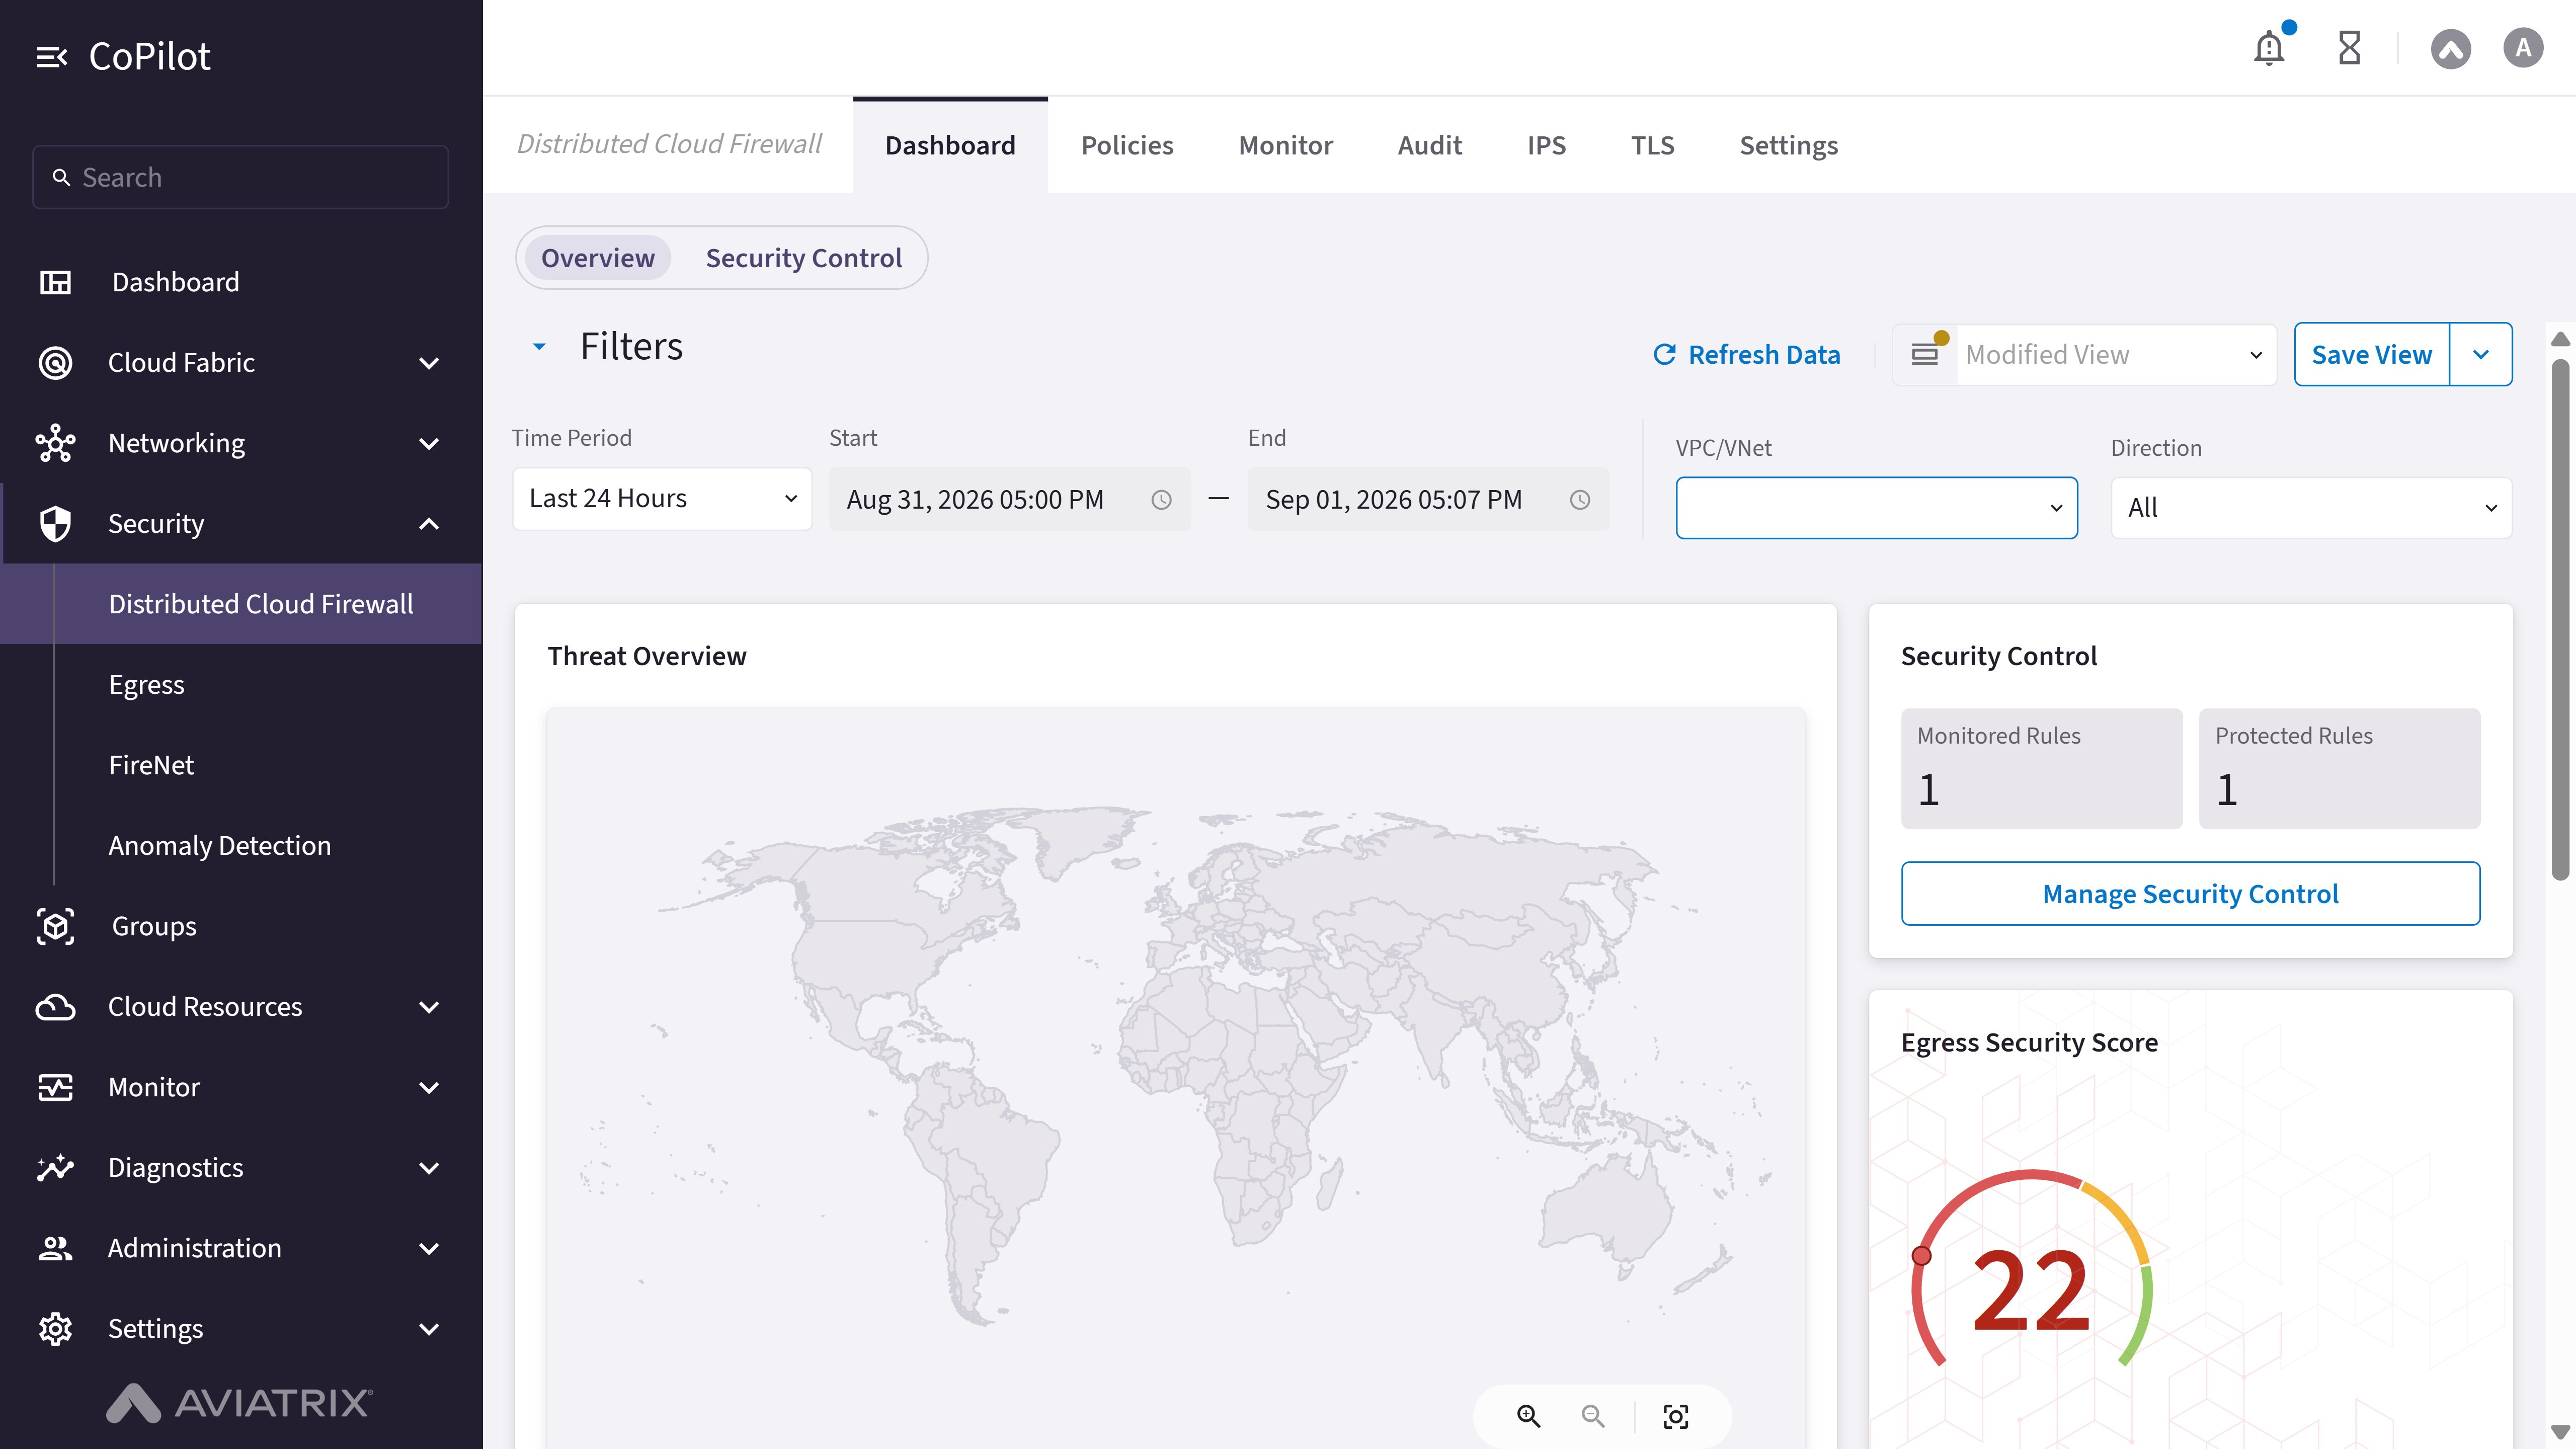
- Filters panel: Filters the dashboard by Time Period (with Start and End date/time), VPC/VNet, and Direction.
- Threat Overview: A zoomable map showing the geographic origin and destination of detected threats.
- Security Control card: Displays Monitored Rules and Protected Rules counts, with a Manage Security Control button.
- Egress Security Score card: Displays an aggregate egress security score, with a Manage VPC/VNets button.
- Total Threats card: Displays Logged and Denied counts.
- Unique Threat IPs card: Displays Logged and Denied counts.
- Geo-Traffic card: Displays Logged and Denied counts.
- SaaS Services panel: Per-service toggle buttons (for example, Azure, GitHub) showing traffic for the selected service.
- Intrusions table: Displays intrusion counts by severity, with a View All button.
Actions
Filter the Dashboard
Filter the Dashboard
- In the Filters panel, select a Time Period, or set a custom Start and End date and time.
- Select a VPC/VNet and a traffic Direction to narrow the dashboard to a specific scope.
Review the Threat Overview map
Review the Threat Overview map
- Review the Threat Overview map for the geographic origin and destination of detected threats.
- Use the zoom in, zoom out, and reset view controls to adjust the map view.
Review the Security Control and Egress Security Score cards
Review the Security Control and Egress Security Score cards
- Review the Monitored Rules and Protected Rules counts on the Security Control card, or select Manage Security Control to go to the Security Control sub-tab.
- Review the Egress Security Score card for an aggregate score representing the security posture of egress traffic, or select Manage VPC/VNets to scope the score to specific VPCs or VNets.
Review the summary cards
Review the summary cards
- Review the Logged and Denied counts on the Total Threats and Unique Threat IPs cards for the selected time range.
- Review the Logged and Denied counts on the Geo-Traffic card. On the SaaS Services panel, select a service button (for example, Azure or GitHub) to view traffic for that service.
Review the Intrusions Table
Review the Intrusions Table
- Review the Intrusions table for a count of intrusions by severity.
- Select View All to open the full list of intrusion detection events.
Parameter Details
| Parameter | Description |
|---|---|
| Critical | The count of intrusions with Critical severity. |
| Major | The count of intrusions with Major severity. |
| Minor | The count of intrusions with Minor severity. |
| Informational | The count of intrusions with Informational severity. |
Review Identified Threats and Threats Activities
Review Identified Threats and Threats Activities
- Review the Identified Threats panel for a breakdown of threats by category and severity.
- Review the Threats Activities panel for a timeline of threat detections over the selected time range.
Purpose
The Security Control sub-tab creates and manages security control templates that monitor or protect against specific categories of egress traffic and threat exposure.Elements
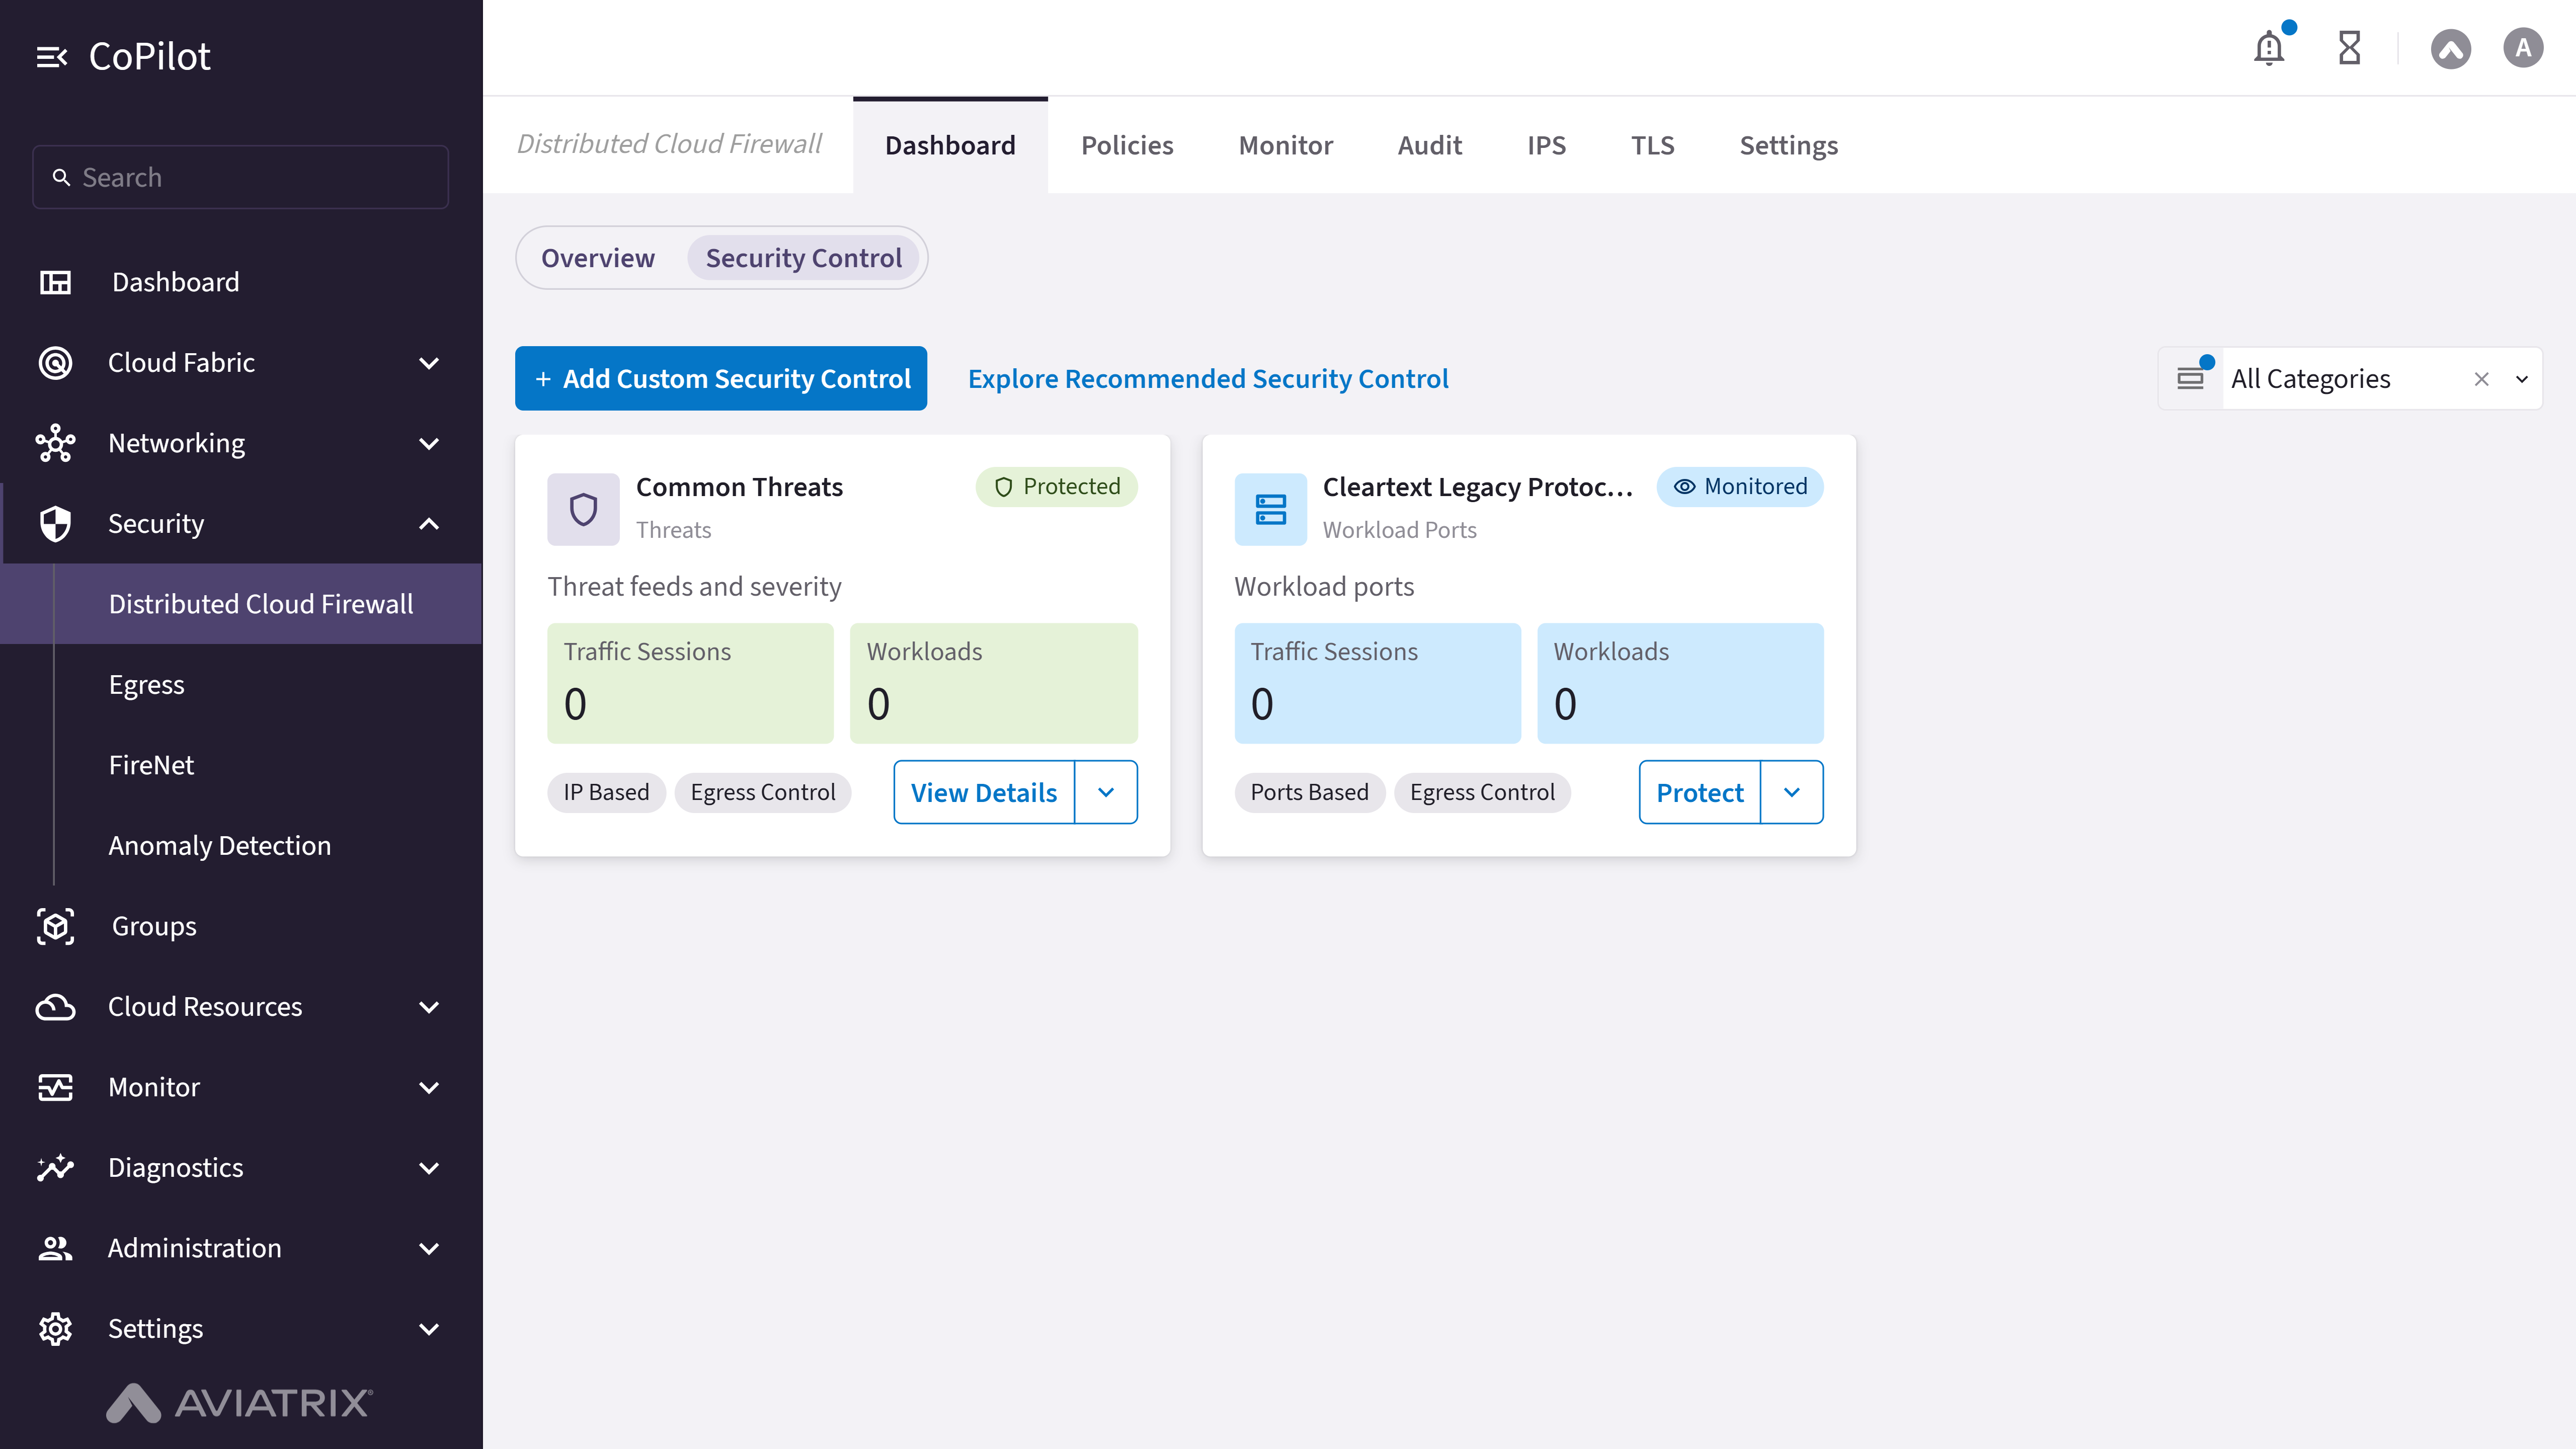
- Add Custom Security Control button: Starts the workflow to create a custom security control.
- Explore Recommended Security Control button: Opens the catalog of recommended security control templates.
- All Categories filter: Filters the template catalog by category — Threats, Geo-Traffic, SaaS Services, Workload Ports, or Web Categories.
- Build Defense in Layers with Security Controls panel: Onboarding guidance with an Add Recommended Security Control button.
Actions
Add a Recommended Security Control
Add a Recommended Security Control
- Select Explore Recommended Security Control, or use the All Categories filter to narrow the catalog to a specific category.
- Choose a control template from one of the available categories: Threats, Geo-Traffic, SaaS Services, Workload Ports, or Web Categories.
- Apply the template in Monitor mode to watch matching traffic and workloads before enforcing.
- Switch the control from Monitor to Protect to enforce active defense once the monitored data looks correct.
Parameter Details
| Category | Description |
|---|---|
| Threats | Monitors or protects against traffic matching known threat signatures. |
| Geo-Traffic | Monitors or protects against traffic to or from specific geographic regions. |
| SaaS Services | Monitors or protects against traffic to or from specific SaaS applications. |
| Workload Ports | Monitors or protects against traffic on specific destination ports. |
| Web Categories | Monitors or protects against traffic to specific web content categories. |
Add a Custom Security Control
Add a Custom Security Control
- Select Add Custom Security Control.
- Define the traffic match criteria and choose Monitor or Protect mode.
View a Security Control
View a Security Control
- Go to Security > Distributed Cloud Firewall > Dashboard > Security Control.
The list of configured security controls appears. - Locate the security control and review its category, mode (Monitor or Protect), and monitored or protected rule counts.
- Optionally use the All Categories filter to narrow the list to a specific category.
Edit a Security Control
Edit a Security Control
- Go to Security > Distributed Cloud Firewall > Dashboard > Security Control.
The list of configured security controls appears. - Locate the security control and click Edit to update its match criteria or switch between Monitor and Protect mode.
- Click Save.
Delete a Security Control
Delete a Security Control
- Go to Security > Distributed Cloud Firewall > Dashboard > Security Control.
The list of configured security controls appears. - Locate the security control and click Delete.
- Read the warning message and confirm the deletion.
Purpose
The Policies page creates and manages distributed firewall policies for securing traffic across the multicloud environments.Elements

- + Rule button: Starts the workflow to create a new firewall rule.
- Manage Rulesets: Opens the dialog to create, edit, or manage rulesets (groupings of rules). Create rulesets before adding rules to them (Controller 8.0 or later).
- Actions button: Provides options to reset the hit count, change rule enforcement (Enforce, Monitor, or Disable), manage logging, and view rule distribution.
- Policy Table: Displays the rule names and their details.
- Edit button: Modifies an existing firewall rule in the table.
- Move button: Changes the priority order of the firewall rules.
- Delete button: Removes an existing firewall rule from the table.
Actions
Configure Rulesets
Configure Rulesets
View Ruleset
View Ruleset
- Go to Security > Distributed Cloud Firewall > Policies.
The Policies page appears with the ruleset list and the Policy Table. - To view the full list of rulesets and their order, click Manage Rulesets.
The Manage Rulesets dialog displays all rulesets and their priority order. - Click Close to return to the Policies tab.
- On the Policies tab, select a ruleset from the ruleset list (dropdown or selector).
The Policy Table shows the rules in that ruleset. - Optionally, use Search or Filter to find a rule within the ruleset.
Requires Controller version 8.0 or later.
Manage Rulesets
Manage Rulesets
- View all rulesets and their order
- Create rulesets
- Edit placement and names
- Change ruleset priority
- Reset traffic counts for selected rulesets
- Commit draft changes
- Go to Security > Distributed Cloud Firewall > Policies.
- Click Manage Rulesets.
The Manage Rulesets dialog appears. - Click the edit icon to edit the ruleset and change the name and placement of the ruleset.
- Click the move icon to change the ruleset priority.
- Click the reset icon to reset the traffic counts for the selected rulesets.
- Click Save.
- Repeat steps 3–6 to create additional rulesets if needed.
- Click Commit to commit the saved changes.
- Click Close.
Create a DCF Ruleset
Create a DCF Ruleset
- Go to Security > Distributed Cloud Firewall > Policies.
- Click Manage Rulesets.
The Manage Rulesets dialog appears. - Click + Ruleset.
The Create Ruleset dialog appears. - Configure Name, Place Ruleset, and Existing Ruleset (if applicable).
Refer to the Parameter Details table. - Click Save.
- Repeat steps 3–5 to create additional rulesets if needed.
- Click Close.
- On the Policies tab, select a ruleset from the Ruleset dropdown to add rules to it.
Parameter Details
| CoPilot Parameter Name | Description |
|---|---|
| Name | Enter a name for the ruleset. |
| Place Ruleset | Select where to place the ruleset: above or below an existing ruleset, or at the top or bottom of the ruleset list. |
| Existing Ruleset | If you select Above or Below in Place Ruleset, select the existing ruleset from this list. |
Manage Firewall Rules
Manage Firewall Rules
Create Firewall Rule
Create Firewall Rule
- Go to Security > Distributed Cloud Firewall > Policies.
- Click + Rule.
- Configure the rule parameters. Refer to the Parameter Details table.
- Save the rule.
Parameter Details
| CoPilot Parameter Name | Description |
|---|---|
| Name | Distributed Cloud Firewall rule name. |
| Source Groups | The groups (SmartGroup, ExternalGroup, Threat Feed, Country) that originate traffic. You must create the SmartGroups and ExternalGroups before creating a DCF rule. Note: You must include at least one SmartGroup. You cannot have an ExternalGroup as both a source and a destination. |
| Destination Groups | The groups (SmartGroup, ExternalGroup, Threat Feed, Country) that terminate traffic. You must create the SmartGroups and ExternalGroups before creating a DCF rule. Note: You must include at least one SmartGroup. You cannot have an ExternalGroup as both a source and a destination. If you are using Distributed Cloud Firewall rules for egress purposes, you must:
The Destination Group must be Public Internet if all of the following are true:
|
| WebGroups | Select the WebGroups that filter egress traffic. You must create these groups before creating a DCF rule. |
| Protocol | Select TCP, UDP, ICMP, or Any. If you select TCP or UDP you can enter a port number or port range. Note: If a WebGroup is included in the rule, a warning displays if any non-standard ports are selected for TCP or UDP. Non-standard ports are those that are not commonly used for the selected protocol, such as port 80 for HTTP or port 443 for HTTPS. The ICMP protocol is unavailable if a WebGroup is selected, because WebGroups are only supported for TLS traffic. If UDP or ICMP is selected, Ensure TLS and TLS Decryption toggles are unavailable. |
| Port | Enter a port numbers or port range for the protocol. |
| Enforcement | Controls how the rule participates in policy evaluation. Available in Controller 10.1.0 or later. In Controller 10.1.0, this field changes from a two-value slider to a three-value dropdown, adding a new Disable option.
Note: The Disable option is not available for rules created through a Kubernetes Custom Resource Definition (CRD) in Controller 10.1.0. CRD-managed rules recognize only Enforce and Monitor. CRD support for the Disable option is planned for Controller 10.2.0. |
| Log |
Note: Aviatrix recommends not logging Permit rules. |
| Rule Behavior | |
| Action | Select Permit or Deny. This determines the action applied to matching traffic. |
| SG Orchestration | On: The rule is available for Security Group Orchestration. The SG Orchestration toggle is Off for new rules when any of the following are true:
|
| Ensure TLS | Turn On if you want traffic that matches the ports and Source and Destination Groups but that is not TLS to be denied. Traffic is denied (dropped) even if HTTP traffic matches domains or URLs in WebGroups. |
| TLS Decryption | Turn On to enable TLS decryption. Important: TLS Decryption must be enabled if a URL-based WebGroup is selected. TLS decryption intercepts encrypted HTTPS traffic, decrypts it for inspection, then re-encrypts it toward the destination. |
| Intrusion Analysis | When Intrusion Detection is enabled, traffic is inspected for threats and results appear on Detected Intrusions. When Intrusion Detection and TLS Decryption are both enabled, the TLS stream is temporarily decrypted and inspected for intrusions. Note: Download the Aviatrix CA certificate (Controller 7.0) or upload your own certificate (Controller 7.1 or later) before creating a policy that uses IDS or TLS Decryption. |
| TLS Profile | Select the TLS profile to use for the rule. |
| Rule Priority | |
| Place Rule | Select Above, Below, Top, Bottom, or Priority. |
| Existing Rule | If you select Above or Below for Place Rule, select the existing rule whose position is affected by the new rule. |
| Priority Number | If you selected Priority for Place Rule, enter a priority number for the new rule. If another rule already has that priority, it moves down in the list. Zero (0) is the highest priority number. You can change rule priority after creation using the arrow icon next to the rule in the Rule table. |
Edit Firewall Rule
Edit Firewall Rule
- Go to Security > Distributed Cloud Firewall > Policies.
- Locate the rule in the Policy table and click the Edit button.
- Update the desired parameters.
- Save your changes.
Move Firewall Rule
Move Firewall Rule
- Go to Security > Distributed Cloud Firewall > Policies.
- Locate the rule in the Policy Table and click the Move button.
- Move the rule to the desired position in the priority order.
- Save the new order.
Delete Firewall Rule
Delete Firewall Rule
- Go to Security > Distributed Cloud Firewall > Policies.
- Locate the rule in the Policy Table and click the Delete button.
- Confirm the deletion.
Change Rule Enforcement, Reset Hit Count, or Manage Logging
Change Rule Enforcement, Reset Hit Count, or Manage Logging
- Go to Security > Distributed Cloud Firewall > Policies.
- Locate the rule in the Policy Table and open the row-level Actions menu.
- Select the action you want to apply — for example, Reset Hit Count, or change the rule’s enforcement to Enforce, Monitor, or Disable, or change logging.
Rules created through a Kubernetes Custom Resource Definition (CRD) cannot use the Disable option in Controller 10.1.0. CRD-managed rules recognize only Enforce and Monitor.
- Policy Logs
- Intrusion Logs
Purpose
The Policy Logs page displays traffic logs generated by the Distributed Cloud Firewall policies. It helps monitor allowed and denied traffic, and supports troubleshooting and audit of policy enforcement across cloud networks.Elements

- Auto Refresh toggle: Enables or disables automatic refreshing of the log data.
- Policy Logs table: Displays policy rule logs and their details.
Actions
View Policy Logs
View Policy Logs
- Go to Security > Distributed Cloud Firewall > Monitor.
Select the Policy Logs tab. - The Policy Logs page appears with the Policy Logs table.
- Review traffic logs for allowed and denied traffic.
- Optionally, use the Auto Refresh toggle to enable or disable automatic refreshing of log data.
Parameter Details
| CoPilot Parameter Name | Description |
|---|---|
| Timestamp | Shows the date and time when the traffic log is recorded. |
| Rule | Shows the firewall policy rule that matches the traffic. |
| Gateway | Shows the gateway that processes the traffic. |
| Source IP | Shows the source IP address of the traffic. |
| Destination IP | Shows the destination IP address of the traffic. |
| Source MAC address | Shows the source MAC address of the traffic. |
| Destination MAC address | Shows the destination MAC address of the traffic. |
| SNI | Shows the server name indication extracted from TLS traffic. |
| Decrypted by | Shows the gateway that performs traffic decryption. |
| URL | Shows the destination URL accessed by the traffic. |
| Protocol | Shows the traffic protocol such as TCP, UDP, or ICMP. |
| Source port | Shows the source port number used by the traffic. |
| Destination port | Shows the destination port number used by the traffic. |
| Reason | Shows the reason for the policy decision. |
| Action | Shows whether the traffic is allowed or denied. |
| Enforced | Shows whether the policy enforcement is applied. |
| Log Enrichment Fields (Preview) | |
| Tags | Shows the cloud resource tags for the resource associated with the traffic, as key-value pairs from your cloud account. |
| EU Region | Shows whether the resource associated with the traffic is located in the European Union. |
| Service Name | Shows the name of the cloud service that matches an ExternalGroup in the rule, such as a storage or database service. |
| Threat Severity | Shows the severity of the matched entry when the rule includes a Threat Feed group.
|
| Threat Type | Shows the threat category from the threat intelligence feed when the rule includes a Threat Feed group. Available categories depend on the feed and can change as the feed updates. |
Purpose
The Intrusion Logs page displays security events detected by the Distributed Cloud Firewall intrusion detection engine. It helps identify suspicious traffic, analyze threats, and support security investigation across cloud environments.Elements

- Intrusion Logs table: Displays intrusion detection logs and their details.
Actions
View Intrusion Logs
View Intrusion Logs
- Go to Security > Distributed Cloud Firewall > Monitor.
Select the Intrusion Logs tab. - The Intrusion Logs page appears with the Intrusion Logs table.
- Review security events detected by the intrusion detection engine.
Parameter Details
| CoPilot Parameter Name | Description |
|---|---|
| Timestamp | Shows the date and time when the intrusion event is recorded. |
| Severity | Shows the severity level of the detected intrusion. |
| Source IP | Shows the source IP address of the traffic. |
| Destination IP | Shows the destination IP address of the traffic. |
| Protocol | Shows the network protocol used by the traffic. |
| Source port | Shows the source port number used by the traffic. |
| Destination port | Shows the destination port number used by the traffic. |
| Application protocol | Shows the application-level protocol detected in the traffic. |
| Gateway | Shows the gateway where the intrusion is detected. |
| Category | Shows the intrusion category or attack type. |
| Attack target | Shows the target resource of the detected attack. |
| Deployment | Shows the deployment or environment where the event occurs. |
Purpose
The Audit page displays audit logs for Distributed Cloud Firewall operations. It helps track user actions, review configuration changes, and support security audit and troubleshooting activities.Elements

- Time Period filter: Filters audit logs based on a selected time range.
Actions
View Audit Logs
View Audit Logs
- Go to Security > Distributed Cloud Firewall > Audit.
- The Audit page appears with audit logs for DCF operations.
- Optionally, use the Time Period filter to filter logs by a selected time range.
- Review user actions, configuration changes, and audit findings.
Parameter Details
| CoPilot Parameter Name | Description |
|---|---|
| Check Name | Shows the name of the audit check performed. |
| Status | Shows whether the audit check passed or failed. |
| Severity | Shows the severity level of the audit finding. |
| Resource | Shows the resource associated with the audit finding. |
| Details | Provides additional information about the audit finding. |
- Applied VPC/VNets
- Profiles
- Rules Feeds
Purpose
The Applied VPC/VNets page summarizes where intrusion prevention is applied across VPCs and VNets and helps you confirm IPS coverage before you change profiles or rule feeds.Elements

- + VPC/VNet button: Opens a form to add IPS profile to a VPC/VNet.
- Search bar: Narrow the applied VPC/VNets table by name or attributes.
- Applied VPC/VNets table: Lists the VPCs and VNets where IPS is applied.
- Edit button: Opens a form to change the IPS profile applied to the VPC/VNet.
- Remove button: Removes the IPS profile from the VPC/VNet.
Actions
View Applied VPC/VNets
View Applied VPC/VNets
- Go to Security > Distributed Cloud Firewall > IPS > Applied VPC/VNets.
- The Applied VPC/VNets page appears with the Applied VPC/VNets table.
Refer to the Parameter Details table for the details of the Applied VPC/VNets parameters. - Optionally use Search or the table toolbar filters to narrow rows.
Parameter Details
| CoPilot Parameter Name | Description |
|---|---|
| Name | The name of the VPC/VNet. |
| Profile | The name of the IPS profile applied to the VPC/VNet. |
| Gateway | The name of the Gateways in the VPC/VNet where the IPS profile is applied. |
| IP CIDRs | The IP CIDRs of the VPC/VNet. |
| Cloud | The Cloud provider of the VPC/VNet. |
| Region | The region of the VPC/VNet. |
Add an IPS Profile to a VPC/VNet
Add an IPS Profile to a VPC/VNet
- Go to Security > Distributed Cloud Firewall > IPS > Applied VPC/VNets.
- Click + VPC/VNet.
- Select the VPC/VNet from the dropdown.
- Select the IPS profile from the dropdown.
- Click Save. A notification appears confirming the addition of the IPS profile to the VPC/VNet.
Edit an IPS Profile on a VPC/VNet
Edit an IPS Profile on a VPC/VNet
- Go to Security > Distributed Cloud Firewall > IPS > Applied VPC/VNets.
- Locate the VPC/VNet in the table and click the edit icon.
The Edit IPS Profile form appears. - Select the new IPS profile from the dropdown.
- Click Save. A notification appears confirming the edit of the IPS profile on the VPC/VNet.
Remove an IPS Profile from a VPC/VNet
Remove an IPS Profile from a VPC/VNet
- Go to Security > Distributed Cloud Firewall > IPS > Applied VPC/VNets.
- Locate the VPC/VNet in the table and click the remove icon.
The Remove IPS Profile confirmation dialog appears. - Read and understand the message, and tick to confirm the removal.
- Click Remove. A notification appears confirming the removal of the IPS profile from the VPC/VNet.
Purpose
The Profiles page lists intrusion prevention profiles that you can attach to DCF rules for the prevention of network intrusions.Elements

- + Custom Profile: Opens the flow to define a new custom IPS profile.
- Profiles table: Lists added custom IPS profiles.
- Search bar: Narrow the profiles table by name or attributes.
- Edit: Edits a custom IPS profile.
- Delete: Deletes a custom IPS profile.
- Actions: Opens the context menu to clone a profile and set an IPS profile active.
Actions
View IPS Profiles
View IPS Profiles
- Go to Security > Distributed Cloud Firewall > IPS > Profiles.
- The IPS Profiles page appears with the IPS Profiles table.
- Refer to the Parameter Details table for the details of the IPS profiles parameters.
- Optionally use Search or the table toolbar filters to narrow rows.
Parameter Details
| CoPilot Parameter Name | Description |
|---|---|
| Name | The name of the IPS profile. |
| Drop Level | The minimum Suricata signature severity level at which matching traffic is dropped.
|
| Log Level | The severity level at which alerts are generated. |
| SID Exceptions | The total number of Signature ID (SID) overrides configured on the profile. Includes both Ignored SIDs (fully suppressed — no alert or drop) and Alert Only SIDs (alert generated, traffic not dropped) |
View an IPS Profile
View an IPS Profile
- Go to Security > Distributed Cloud Firewall > IPS > Profiles.
- Locate the IPS Profile in the table and click the profile name.
- The IPS Profile details page appears with the IPS Profile details.
- Refer to the Parameter Details table for the details of the IPS Profile parameters.
Parameter Details
| CoPilot Parameter Name | Description |
|---|---|
| Name | The name of the IPS profile. |
| Drop Level | |
| Log Level | |
| Rule Feeds | |
| SID | The SID exceptions in the IPS profile. |
| Action | The action to take when the SID is matched. |
Create a Custom IPS profile
Create a Custom IPS profile
- Go to Security > Distributed Cloud Firewall > IPS > Profiles.
- Click + Custom Profile.
- Configure the profile parameters. Refer to the Parameter Details table.
- Click Save.
Parameter Details
| CoPilot Parameter Name | Description |
|---|---|
| Name | The name of the IPS profile. |
| Rule Feed | |
| Drop Level |
|
| Alert Level |
Edit an IPS profile
Edit an IPS profile
- Go to Security > Distributed Cloud Firewall > IPS > Profiles.
- Locate the IPS Profile in the table and click the edit icon.
The Edit IPS Profile form appears. - Update the profile parameters. Refer to the Parameter Details table.
- Click Save.
Parameter Details
| CoPilot Parameter Name | Description |
|---|---|
| Name | The name of the IPS profile. |
| Rule Feed | |
| Drop Level |
|
| Alert Level |
Delete an IPS profile
Delete an IPS profile
- Go to Security > Distributed Cloud Firewall > IPS > Profiles.
- Locate the IPS Profile in the table and click the delete icon.
The Delete IPS Profile confirmation dialog appears. - Click Delete.
Clone an IPS Profile
Clone an IPS Profile
- Go to Security > Distributed Cloud Firewall > IPS > Profiles.
- Locate the IPS Profile in the table and click Actions (⋮) > Clone profile.
The Clone Profile form appears. - Update the profile parameters. Refer to the Parameter Details table.
- Click Clone.
Parameter Details
| CoPilot Parameter Name | Description |
|---|---|
| Name | The name of the IPS profile. |
| Rule Feed | |
| Drop Level |
|
| Alert Level |
Set an IPS Profile Active
Set an IPS Profile Active
- Go to Security > Distributed Cloud Firewall > IPS > Profiles.
- Locate the IPS Profile in the table and click Actions (⋮) > Set As Active.
- Read and understand the message, and tick to confirm the setting.
- Click Apply.
Purpose
The Rules Feeds page lists intrusion prevention rules used when IPS inspection runs for Distributed Cloud Firewall.Elements

- + Custom Rule Feed: Opens the form to define a new custom IPS rule.
- Rules table: Lists added custom IPS rules.
- Search bar: Narrow the rules table by name or attributes.
- Edit button: Edits a custom IPS rule.
- Delete button: Deletes a custom IPS rule.
- Actions (⋮) button: Opens the context menu to download a rule feed.
Actions
View Custom Rules
View Custom Rules
- Go to Security > Distributed Cloud Firewall > IPS > Rules Feeds.
- The Custom Rules page appears with the Custom Rules table.
- Refer to the Parameter Details table for the details of the Custom Rules parameters.
- Optionally use Search or the table toolbar filters to narrow rows.
Parameter Details
| CoPilot Parameter Name | Description |
|---|---|
| Name | The name of the custom IPS rule. |
| Rules | The number of rules in the custom IPS rule. |
| Last Updated | The date and time the custom IPS rule was last updated. |
View a Custom Rule
View a Custom Rule
- Go to Security > Distributed Cloud Firewall > IPS > Rules Feeds.
- Locate the custom Rule in the table and click the name of the rule.
The Custom Rule details page appears with the Custom Rule details.
Refer to the Parameter Details table for the details of the Custom Rule parameters.
Parameter Details
| CoPilot Parameter Name | Description |
|---|---|
| SID | The SID of the custom Rule. |
| Content | The content of the custom Rule. |
| Severity | The severity of the custom Rule. |
Create a Custom Rule Feed
Create a Custom Rule Feed
- Go to Security > Distributed Cloud Firewall > IPS > Rules Feeds.
- Click + Custom Rule Feed.
- Enter the name of the custom IPS rule.
- Upload the custom IPS rule feed file.
- Click Upload.
Edit a Custom Rule Feed
Edit a Custom Rule Feed
- Go to Security > Distributed Cloud Firewall > IPS > Rules Feeds.
- Locate the custom Rule Feed in the table and click the edit icon in the row.
The Edit Custom Rule Feed form appears. - Update the name of the custom Rule Feed and upload new rule feed file.
- Click Upload.
Edit a Custom Rule Syntax
Edit a Custom Rule Syntax
- Go to Security > Distributed Cloud Firewall > IPS > Rules Feeds.
- Locate the custom Rule Feed in the table and click the name of the rule.
The Custom Rule Syntax details page appears with a table of the SID and the rule syntax. - Click the edit icon in the row and edit the rule syntax.
- Turn On the Suricata Rule Syntax toggle to edit the rule syntax in the Suricata format.
Refer to the Parameter Details table for the details of the Suricata Rule Syntax parameters. - Click Save. A notification appears confirming the update of the custom Rule Syntax.
Parameter Details
| CoPilot Parameter Name | Description |
|---|---|
| Severity |
|
| Rule | |
| Action |
|
| Protocol |
|
| Direction |
|
| Source | |
| Source Port | |
| Destination | |
| Destination Port | |
| Options |
Delete a Custom Rule Feed
Delete a Custom Rule Feed
- Go to Security > Distributed Cloud Firewall > IPS > Rules Feeds.
- Locate the custom Rule Feed in the table and click the delete icon in the row.
The Delete Custom Rule Feed confirmation dialog appears. - Click Delete. A notification appears confirming the deletion of the custom Rule Feed.
Download a Custom Rule Feed
Download a Custom Rule Feed
- Go to Security > Distributed Cloud Firewall > IPS > Rules Feeds.
- Locate the custom Rule Feed in the table and click the Actions icon (⋮) in the row.
The Actions menu appears. - Click Download Rule Feed. A notification appears on your browser confirming the download of the custom Rule Feed.
- Profiles
- Decryption CA Certificates
- Trust Bundles
Purpose
The Profiles page is a central management hub for creating, configuring, and managing TLS Profile objects that control how the Distributed Cloud Firewall inspects, validates, and decrypts TLS traffic.Elements

- + Custom Profile: Opens the flow to create a new custom TLS profile.
- Search: Filters rows in the profiles table.
- Profiles table: Shows the list of TLS profiles and their trust and enforcement settings.
- Actions: Edit, Delete, and More (⋮) buttons to edit, delete, and clone a profile.
Actions
View TLS Profiles
View TLS Profiles
- Go to Security > Distributed Cloud Firewall > TLS > Profiles.
The Profiles page appears with the Profiles table. - Refer to the Parameter Details table for the details of the TLS profiles parameters.
- Optionally use Search or the table toolbar filters to narrow rows. The table displays TLS profiles with their name, trust bundle, SNI verification, and enforcement settings.
Parameter Details
| CoPilot Parameter Name | Description |
|---|---|
| Name | The name of the TLS profile. |
| Trust Bundle | Collection of CA certificates used to validate the origin server’s certificate when this TLS profile is applied to a rule. |
| SNI Verification |
|
| Enforcement |
|
Create a TLS Profile
Create a TLS Profile
- Go to Security > Distributed Cloud Firewall > TLS > Profiles.
- Click + Custom Profile.
- Configure the profile parameters. Refer to the Parameter Details table.
- Click Save.
Parameter Details
| CoPilot Parameter Name | Description |
|---|---|
| Name | Enter a name for the TLS profile. |
| Trust Bundle | Collection of CA certificates used to validate the origin server’s certificate when this TLS profile is applied to a rule. |
| SNI Verification |
|
| Enforcement |
|
Edit a TLS Profile
Edit a TLS Profile
- Go to Security > Distributed Cloud Firewall > TLS > Profiles.
The Profiles page appears with the Profiles table. - Locate the profile and use Edit to update the profile parameters. Refer to the Parameter Details table.
- Use More actions (⋮) and click Clone to create a copy of the profile.
- Click Save.
Parameter Details
| CoPilot Parameter Name | Description |
|---|---|
| Name | The name of the TLS profile. |
| Trust Bundle | Collection of CA certificates used to validate the origin server’s certificate when this TLS profile is applied to a rule. |
| SNI Verification |
|
| Enforcement |
|
Delete a TLS Profile
Delete a TLS Profile
- Go to Security > Distributed Cloud Firewall > TLS > Profiles.
The Profiles page appears with the Profiles table. - Locate the profile and click Delete.
- Read the warning message and tick to confirm the deletion.
- Click Delete. A notification appears confirming the deletion.
Purpose
The Decryption CA Certificates page shows the CoPilot-managed Decryption CA used for TLS decryption in DCF flows, its validity, association to a trust bundle, and actions to renew or download the certificate.Elements

- Decryption CA Certificate Certificate card showing the certificate details such as name, expiry date, and trust bundle association.
- Renew Certificate button: Button to renew the decryption CA certificate.
- Download Certificate button: Button to download the decryption CA certificate.
- More Options dropdown: The dropdown menu contains the following options:
- Upload New Certificate: Button to upload a new certificate.
- Upload New Trust Bundle: Button to upload a new trust bundle.
- Remove Certificate: Button to remove the certificate.
- Remove Trust Bundle: Button to remove the trust bundle.
Actions
Renew a Decryption CA Certificate
Renew a Decryption CA Certificate
- Go to Security > Distributed Cloud Firewall > TLS > Decryption CA Certificates.
- Locate the Decryption CA Certificate card to renew.
- Click Renew Certificate.
Download a Decryption CA Certificate
Download a Decryption CA Certificate
- Go to Security > Distributed Cloud Firewall > TLS > Decryption CA Certificates.
- Locate the Decryption CA Certificate card to download.
- Click Download Certificate. A notification on your browser appears confirming the download.
Upload a New Certificate
Upload a New Certificate
- Go to Security > Distributed Cloud Firewall > TLS > Decryption CA Certificates.
- Locate the Decryption CA Certificate card to upload.
- Click the dropdown next to the Download Certificate button and click Upload New Certificate.
The Upload New Certificate dialog appears. - Upload the Certificate and the Certificate Key.
- Click Upload. A notification appears confirming the upload.
Upload a New Trust Bundle
Upload a New Trust Bundle
- Go to Security > Distributed Cloud Firewall > TLS > Decryption CA Certificates.
- Locate the Decryption CA Certificate card to upload.
- Click the dropdown next to the Download Certificate button and click Upload Trust Bundle.
The Upload Trust Bundle dialog appears. - Upload the trust bundle file.
- Click Upload. A notification appears confirming the upload.
Remove a Certificate
Remove a Certificate
- Go to Security > Distributed Cloud Firewall > TLS > Decryption CA Certificates.
- Locate the Decryption CA Certificate card to remove.
- Click the dropdown next to the Download Certificate button and click Remove Certificate.
The Remove Certificate dialog appears. - Click Remove. A notification appears confirming the removal.
Remove a Trust Bundle
Remove a Trust Bundle
- Go to Security > Distributed Cloud Firewall > TLS > Decryption CA Certificates.
- Locate the Decryption CA Certificate card to remove.
- Click the dropdown next to the Download Certificate button and click Remove Trust Bundle.
The Remove Trust Bundle dialog appears. - Click Remove. A notification appears confirming the removal.
Purpose
The Trust Bundles view lists trust bundles available for TLS operations (including those referenced by TLS profiles and the decryption CA configuration).Elements

- + Trust Bundle: Button to start the workflow for adding a new trust bundle.
- Trust Bundles table: Displays the list of added trust bundles and their details.
- Search: Filters trust bundle rows in the table.
Actions
View Trust Bundles
View Trust Bundles
- Go to Security > Distributed Cloud Firewall > TLS > Trust Bundles.
- The Trust Bundles page appears with the Trust Bundles table.
- Refer to the Parameter Details table for the details of the trust bundles parameters.
- Optionally, use Search or the table toolbar filters to narrow rows. The table displays trust bundles with their name.
Add a Trust Bundle
Add a Trust Bundle
- Go to Security > Distributed Cloud Firewall > TLS > Trust Bundles.
- Click + Trust Bundle.
- Enter the name of the trust bundle.
- Upload the trust bundle file.
Note: Ensure the trust bundle file is in .pem format.
- Click Save. A notification appears confirming the addition.
Edit a Trust Bundle
Edit a Trust Bundle
- Go to Security > Distributed Cloud Firewall > TLS > Trust Bundles.
- Locate the trust bundle and click the edit icon in the row.
The Edit Trust Bundle dialog appears. - Update the name of the trust bundle and upload new trust bundle file.
- Click Save.
A notification appears confirming the update.
Note: Ensure the trust bundle file is in .pem format.
Delete a Trust Bundle
Delete a Trust Bundle
- Go to Security > Distributed Cloud Firewall > TLS > Trust Bundles.
The Trust Bundles page appears with the Trust Bundles table. - Locate the trust bundle and click the delete icon in the row.
- Read the warning message and tick to confirm the deletion.
- Click Delete. A notification appears confirming the deletion.
Download a Trust Bundle
Download a Trust Bundle
- Go to Security > Distributed Cloud Firewall > TLS > Trust Bundles.
The Trust Bundles page appears with the Trust Bundles table. - Locate the trust bundle and click the Actions icon (⋮) in the row.
- Click Download Trust Bundle. A notification on your browser appears confirming the download.
Purpose
The Settings page allows configuration of global firewall settings, logging, and alerting options.Elements

- Global Settings Panel: Configure default action, logging, and alert thresholds.
- Notification Settings: Enable alerts for intrusion detection and policy violations.
- Advanced Options: Configure threat intelligence feeds and update intervals.
Actions
Configure Global Firewall Settings
Configure Global Firewall Settings
- Go to Security > Distributed Cloud Firewall > Settings.
- In the Global Settings Panel, configure the default action for unmatched traffic.
- Set the Logging Level (Minimal, Standard, or Detailed).
- Configure Alert Threshold for triggering alerts.
- Save your changes.
Parameter Details
| CoPilot Parameter Name | Description |
|---|---|
| Default Action | Specifies default action for unmatched traffic (Allow/Deny). |
| Logging Level | Sets logging verbosity (Minimal, Standard, Detailed). |
| Alert Threshold | Configures thresholds for triggering alerts. |
| Threat Feed URL | URL for external threat intelligence feed. |
| Update Interval | Frequency of threat feed updates. |
Configure Notification Settings
Configure Notification Settings
- Go to Security > Distributed Cloud Firewall > Settings.
- In Notification Settings, enable alerts for intrusion detection and policy violations.
- Configure notification destinations and preferences.
- Save your changes.
Configure Advanced Options
Configure Advanced Options
- Go to Security > Distributed Cloud Firewall > Settings.
- In Advanced Options, configure the Threat Feed URL for external threat intelligence.
- Set the Update Interval for threat feed updates.
- Save your changes.