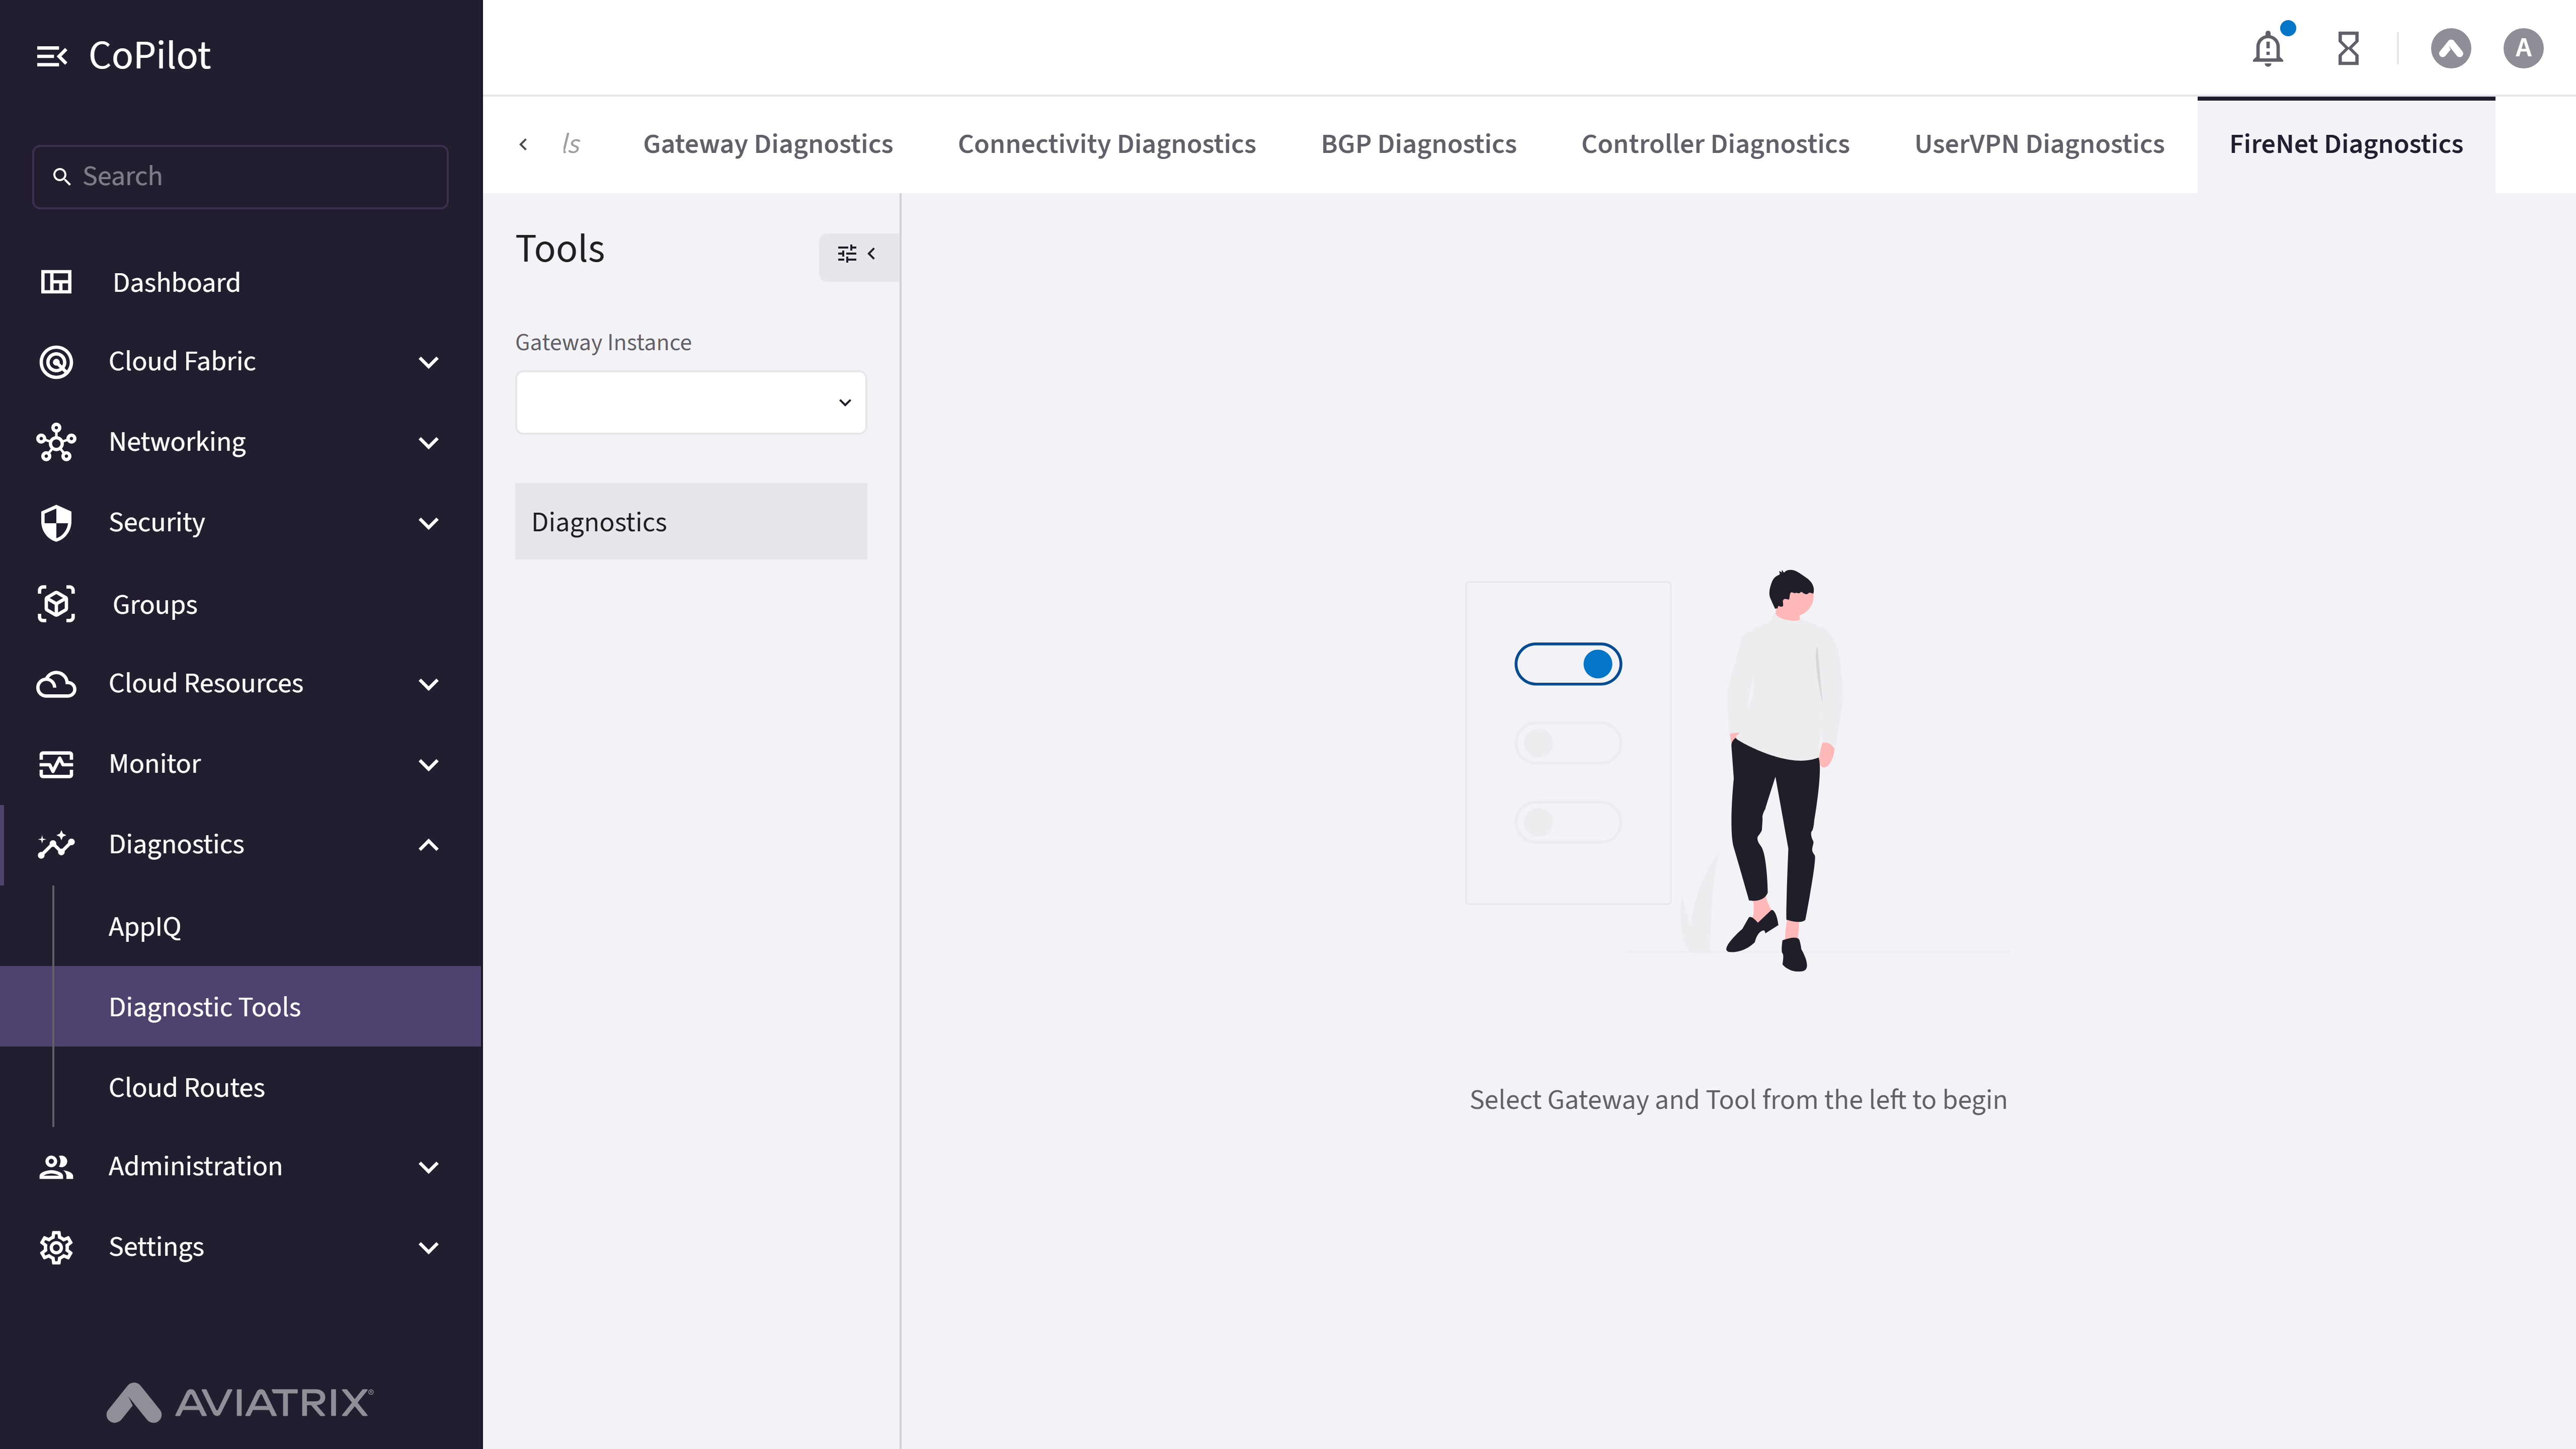
- Gateway Diagnostics
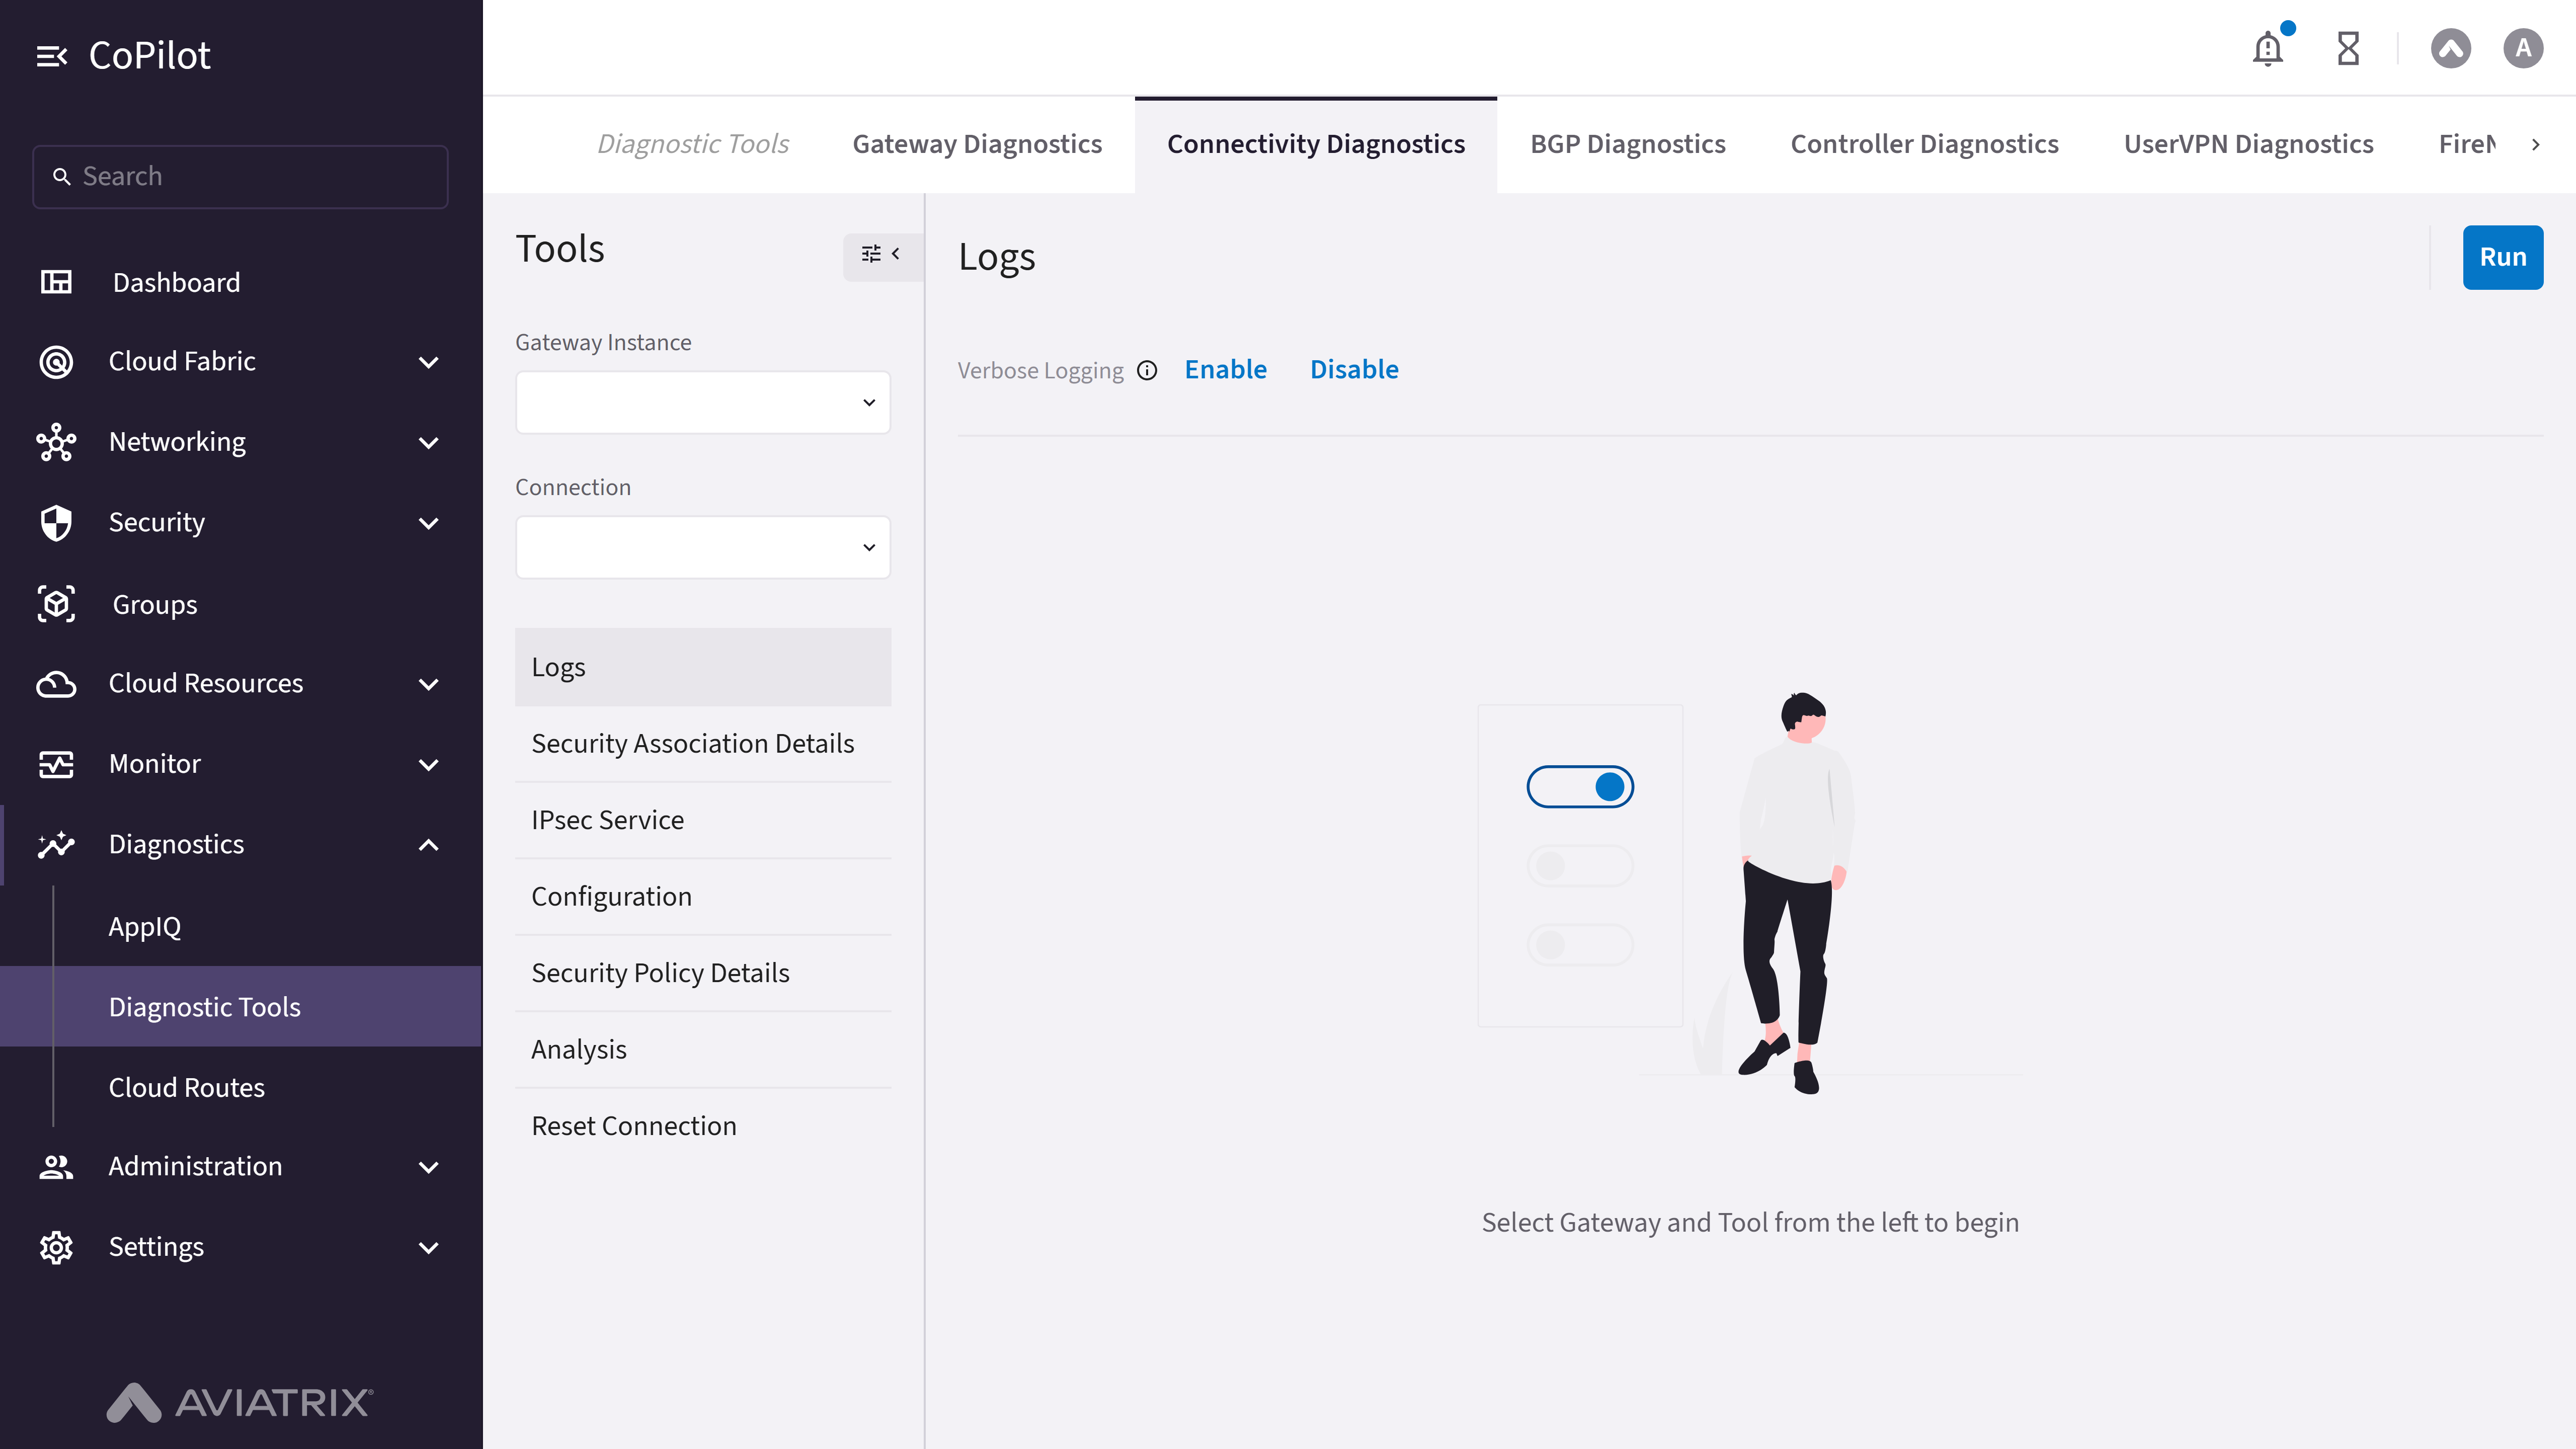
- Connectivity Diagnostics
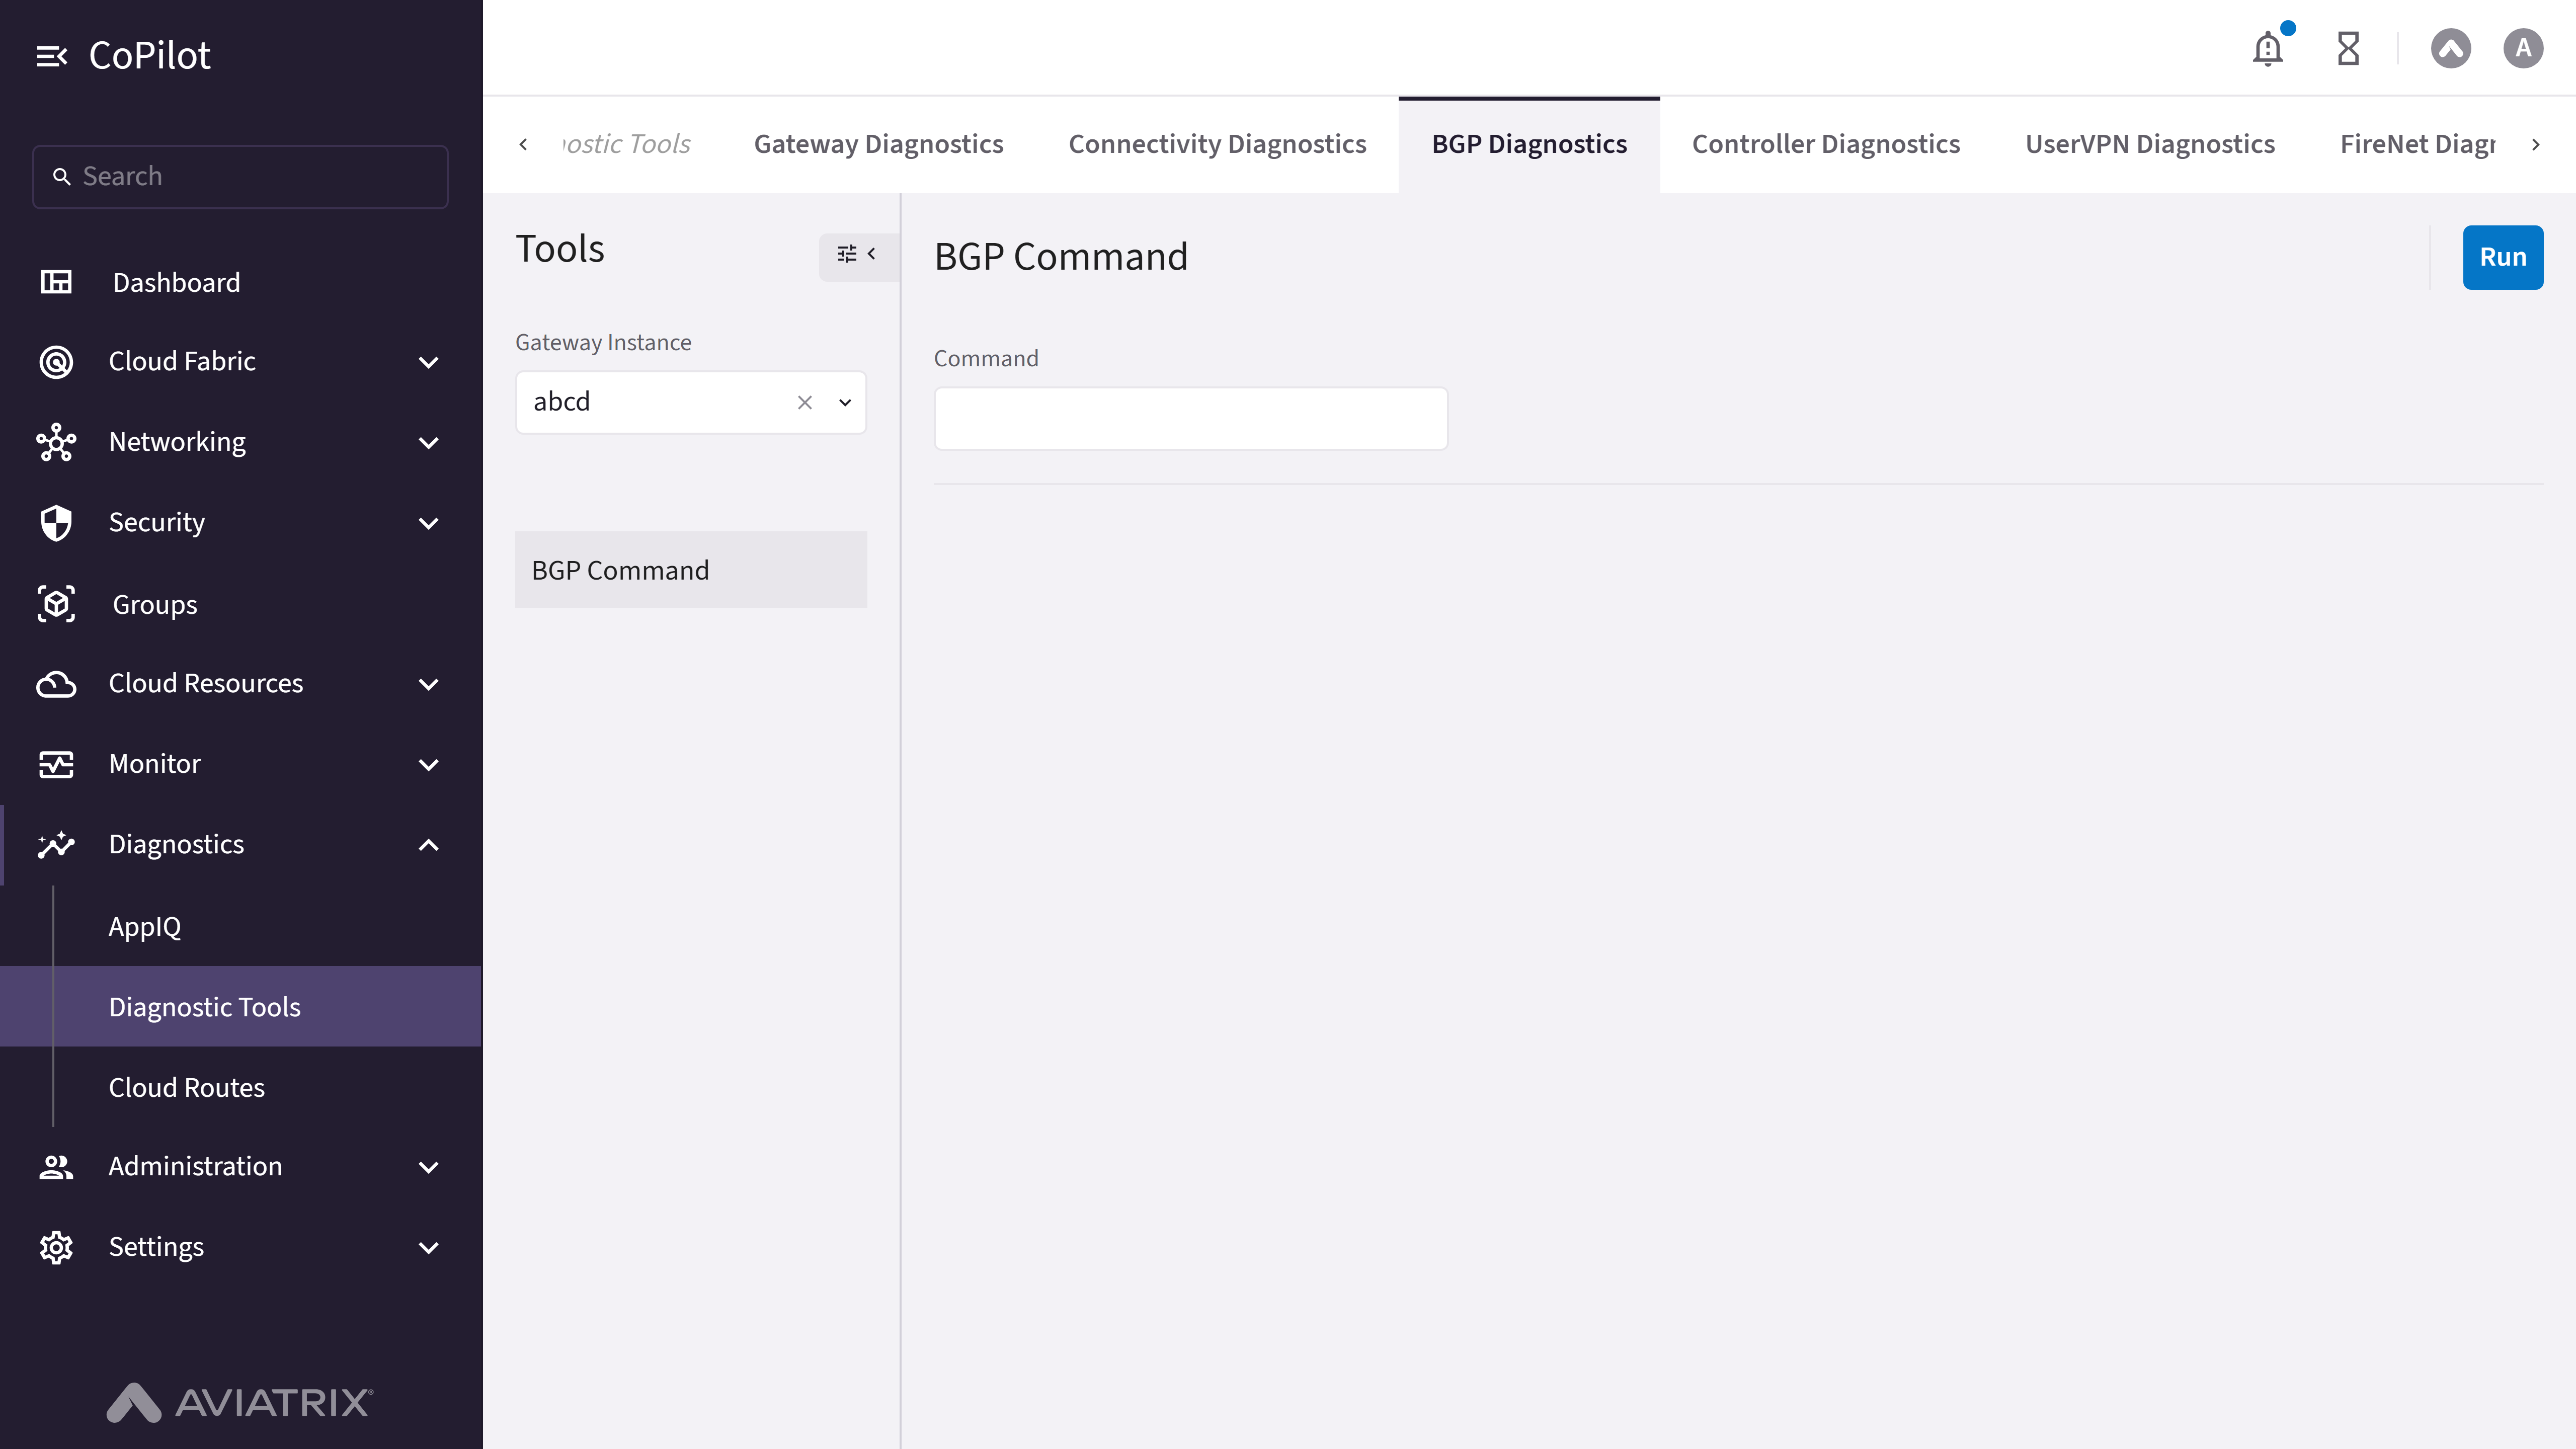
- BGP Diagnostics
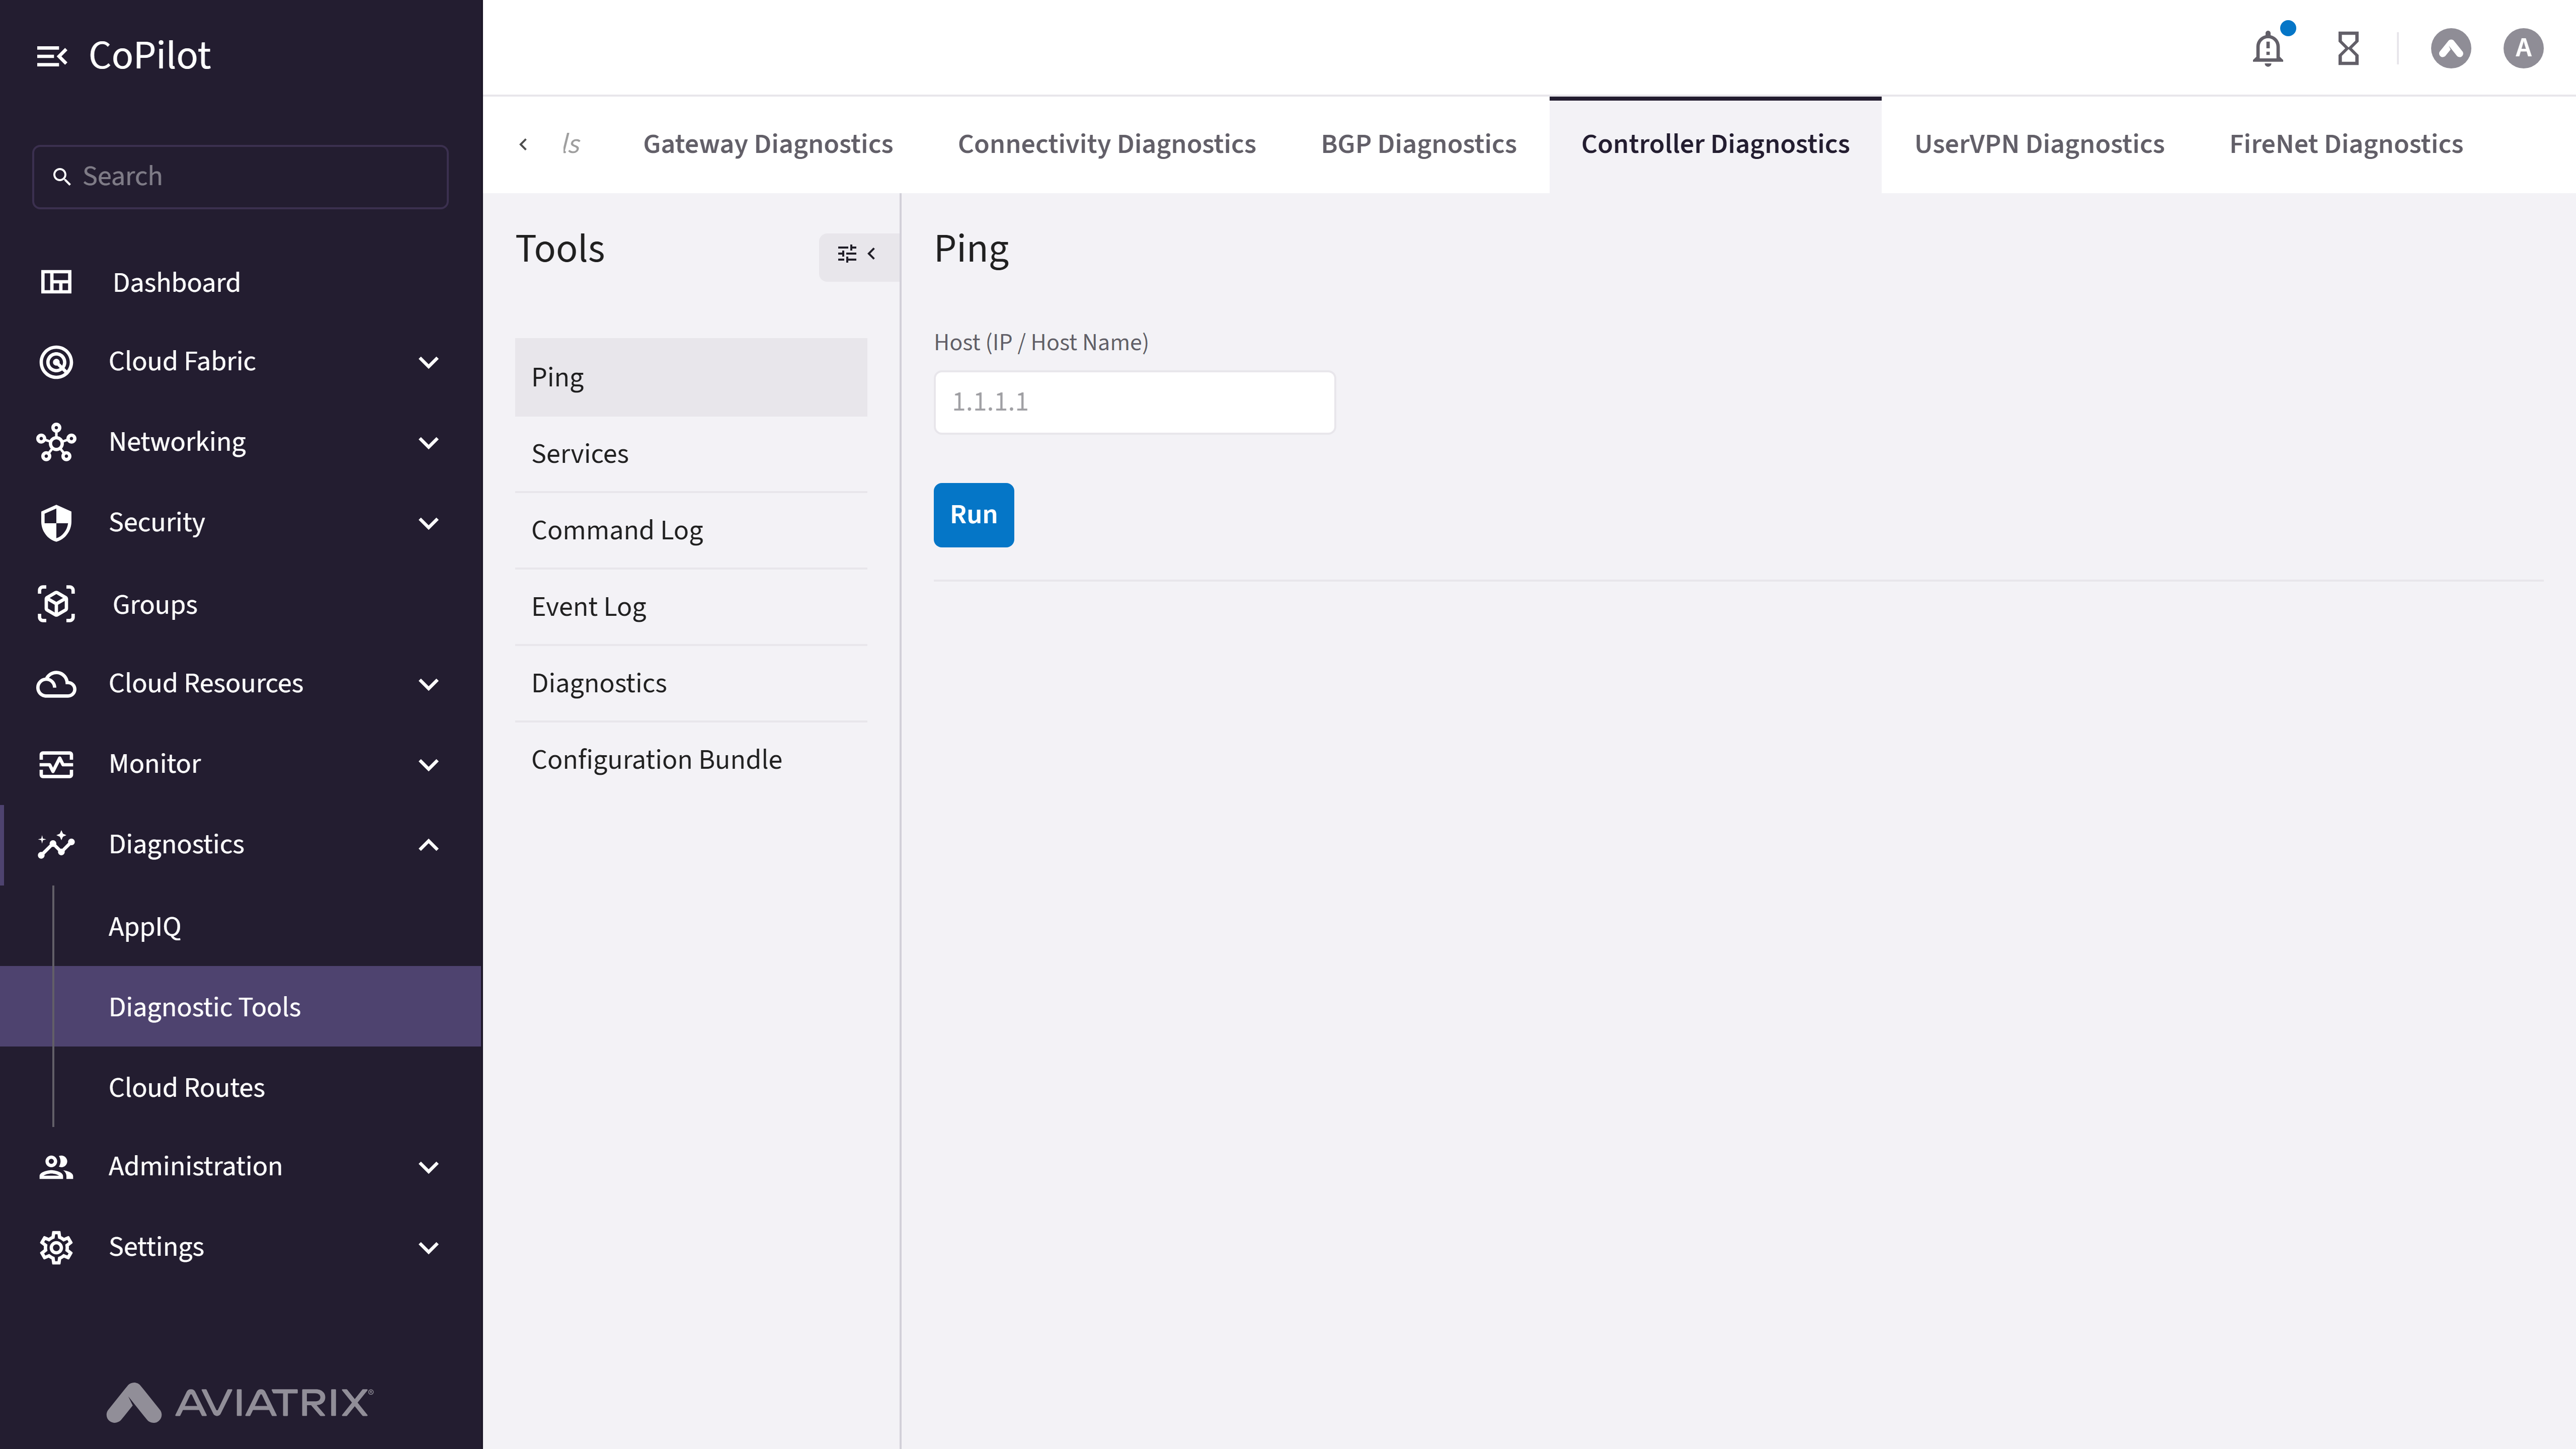
- Controller Diagnostics
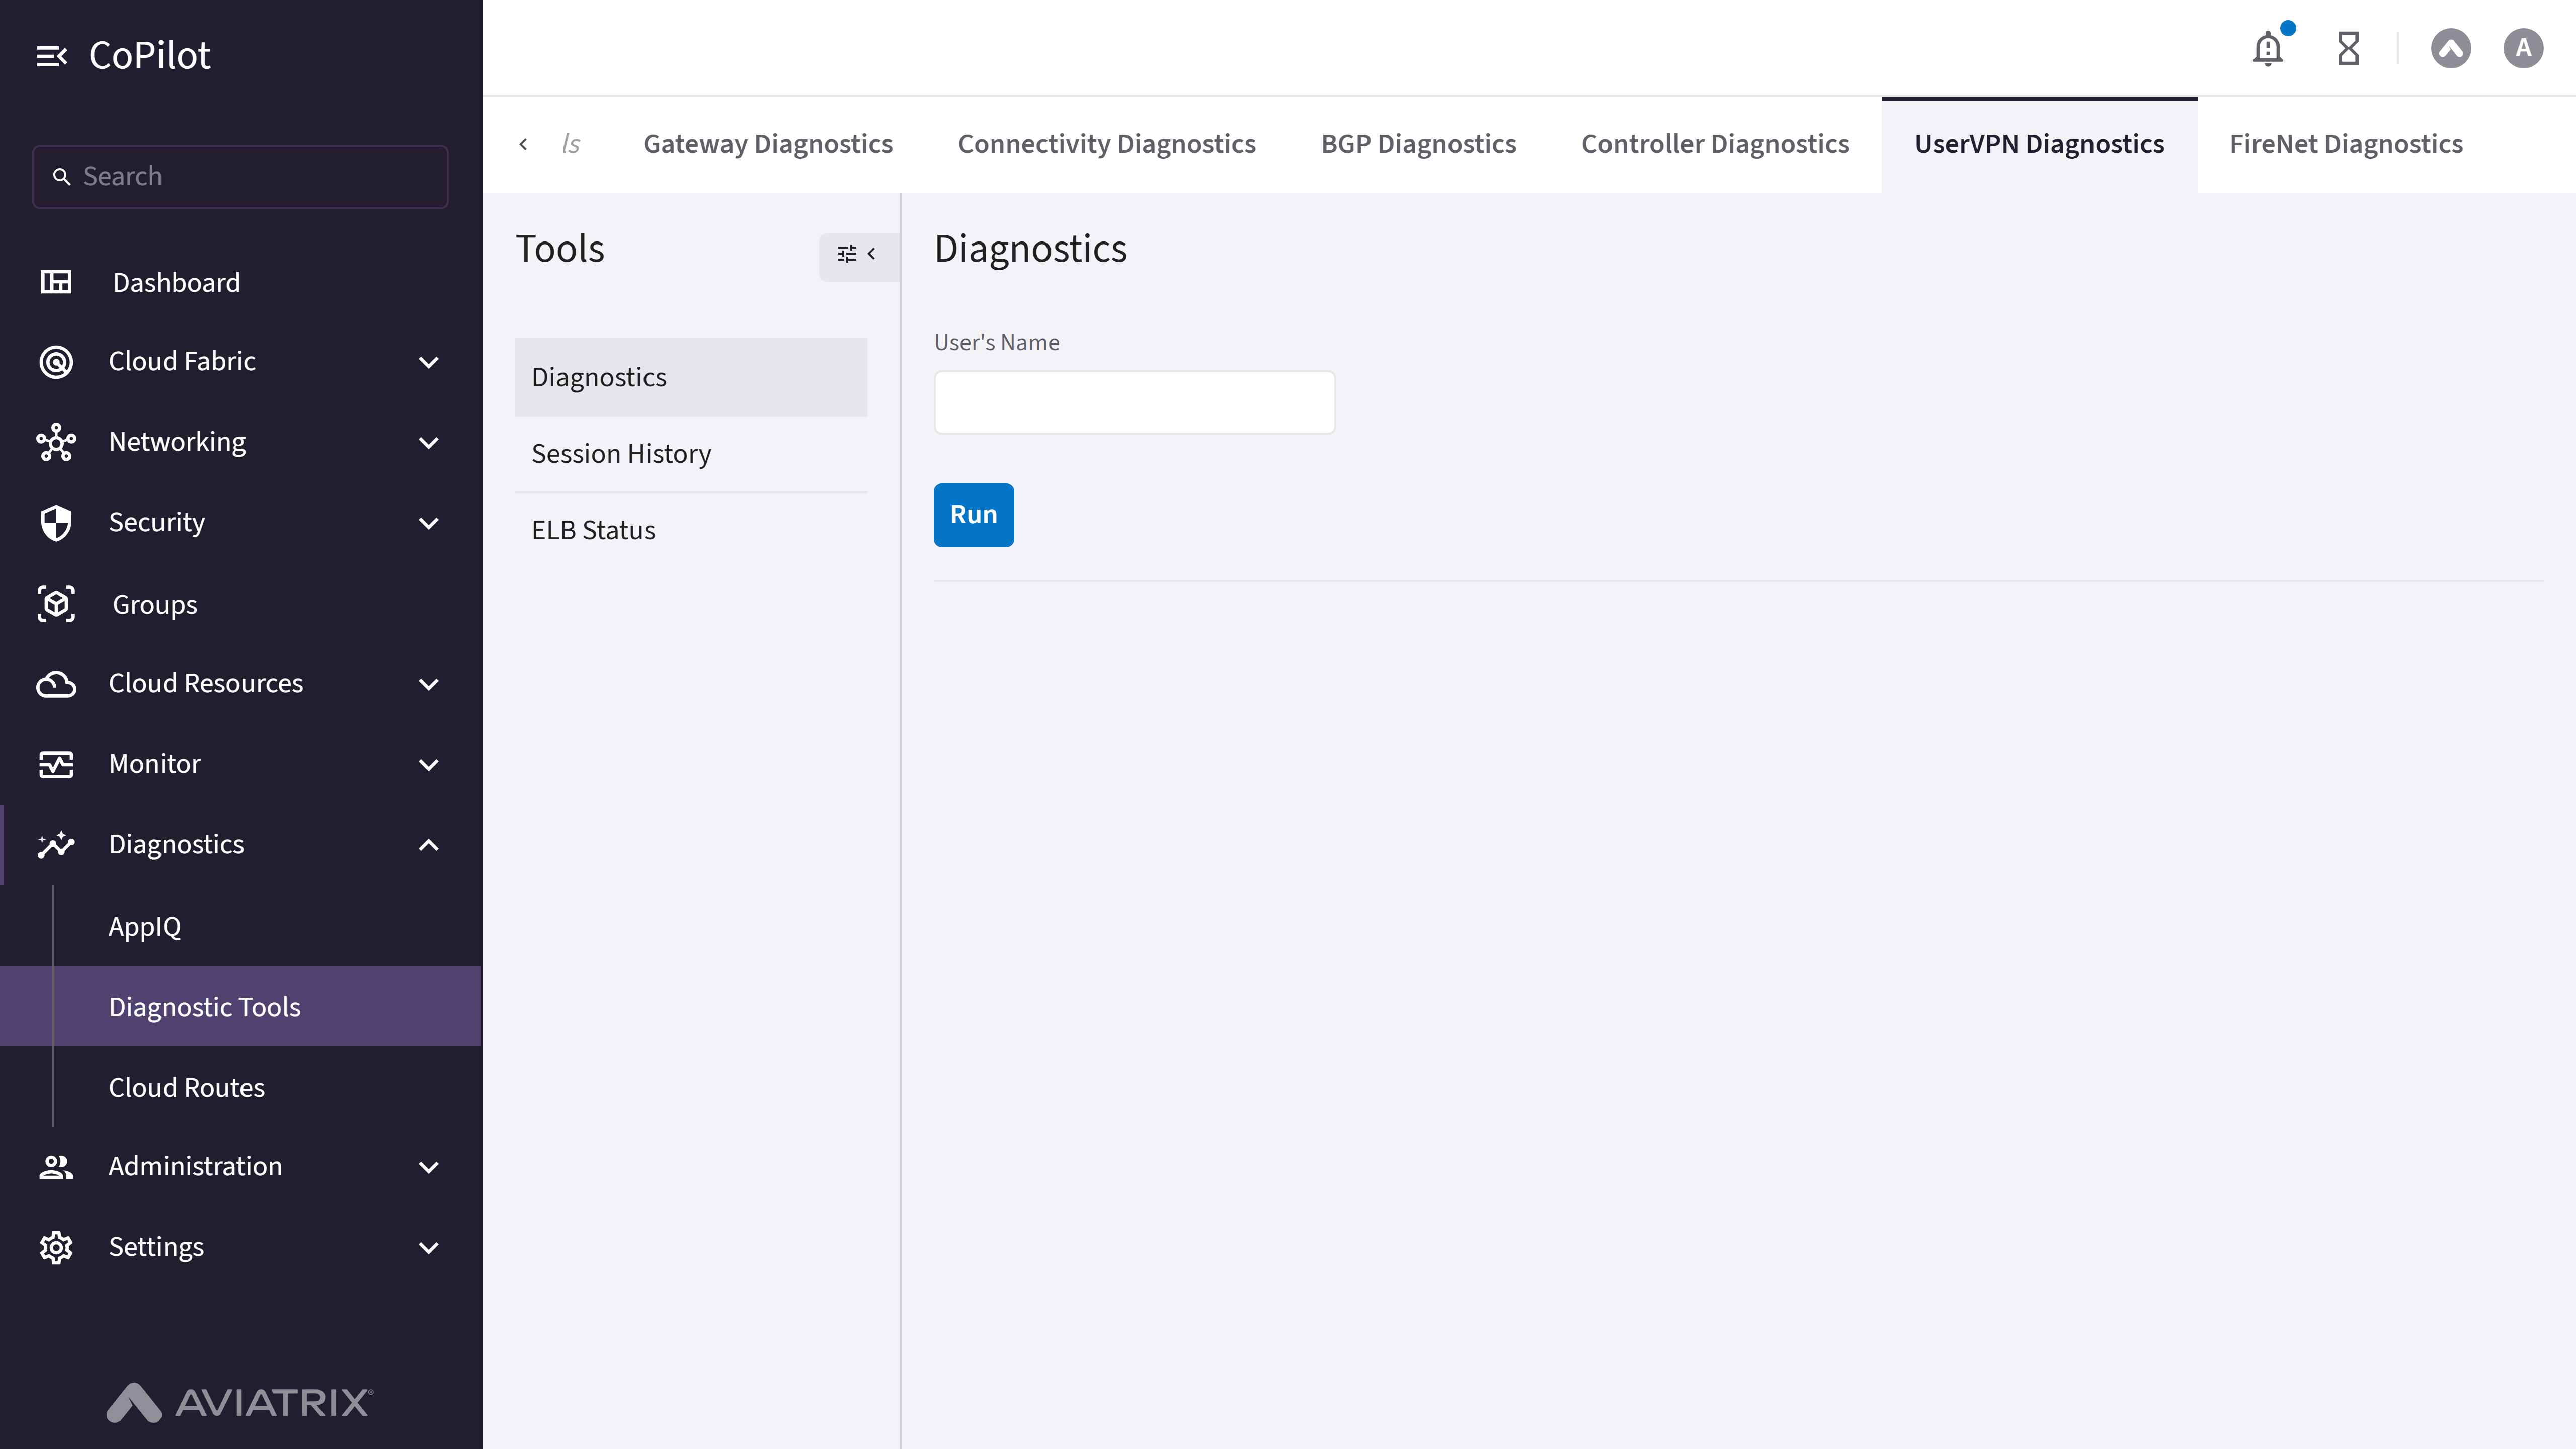
- UserVPN Diagnostics
- FireNet Diagnostics
Purpose
The Gateway Diagnostics section provides tools to test gateway reachability, capture packets, trace paths, check connectivity, view active sessions and interface stats, manage services, run built-in diagnostics, audit spoke gateways for symmetric routing and AZ affinity issues, and download tracelogs.Elements
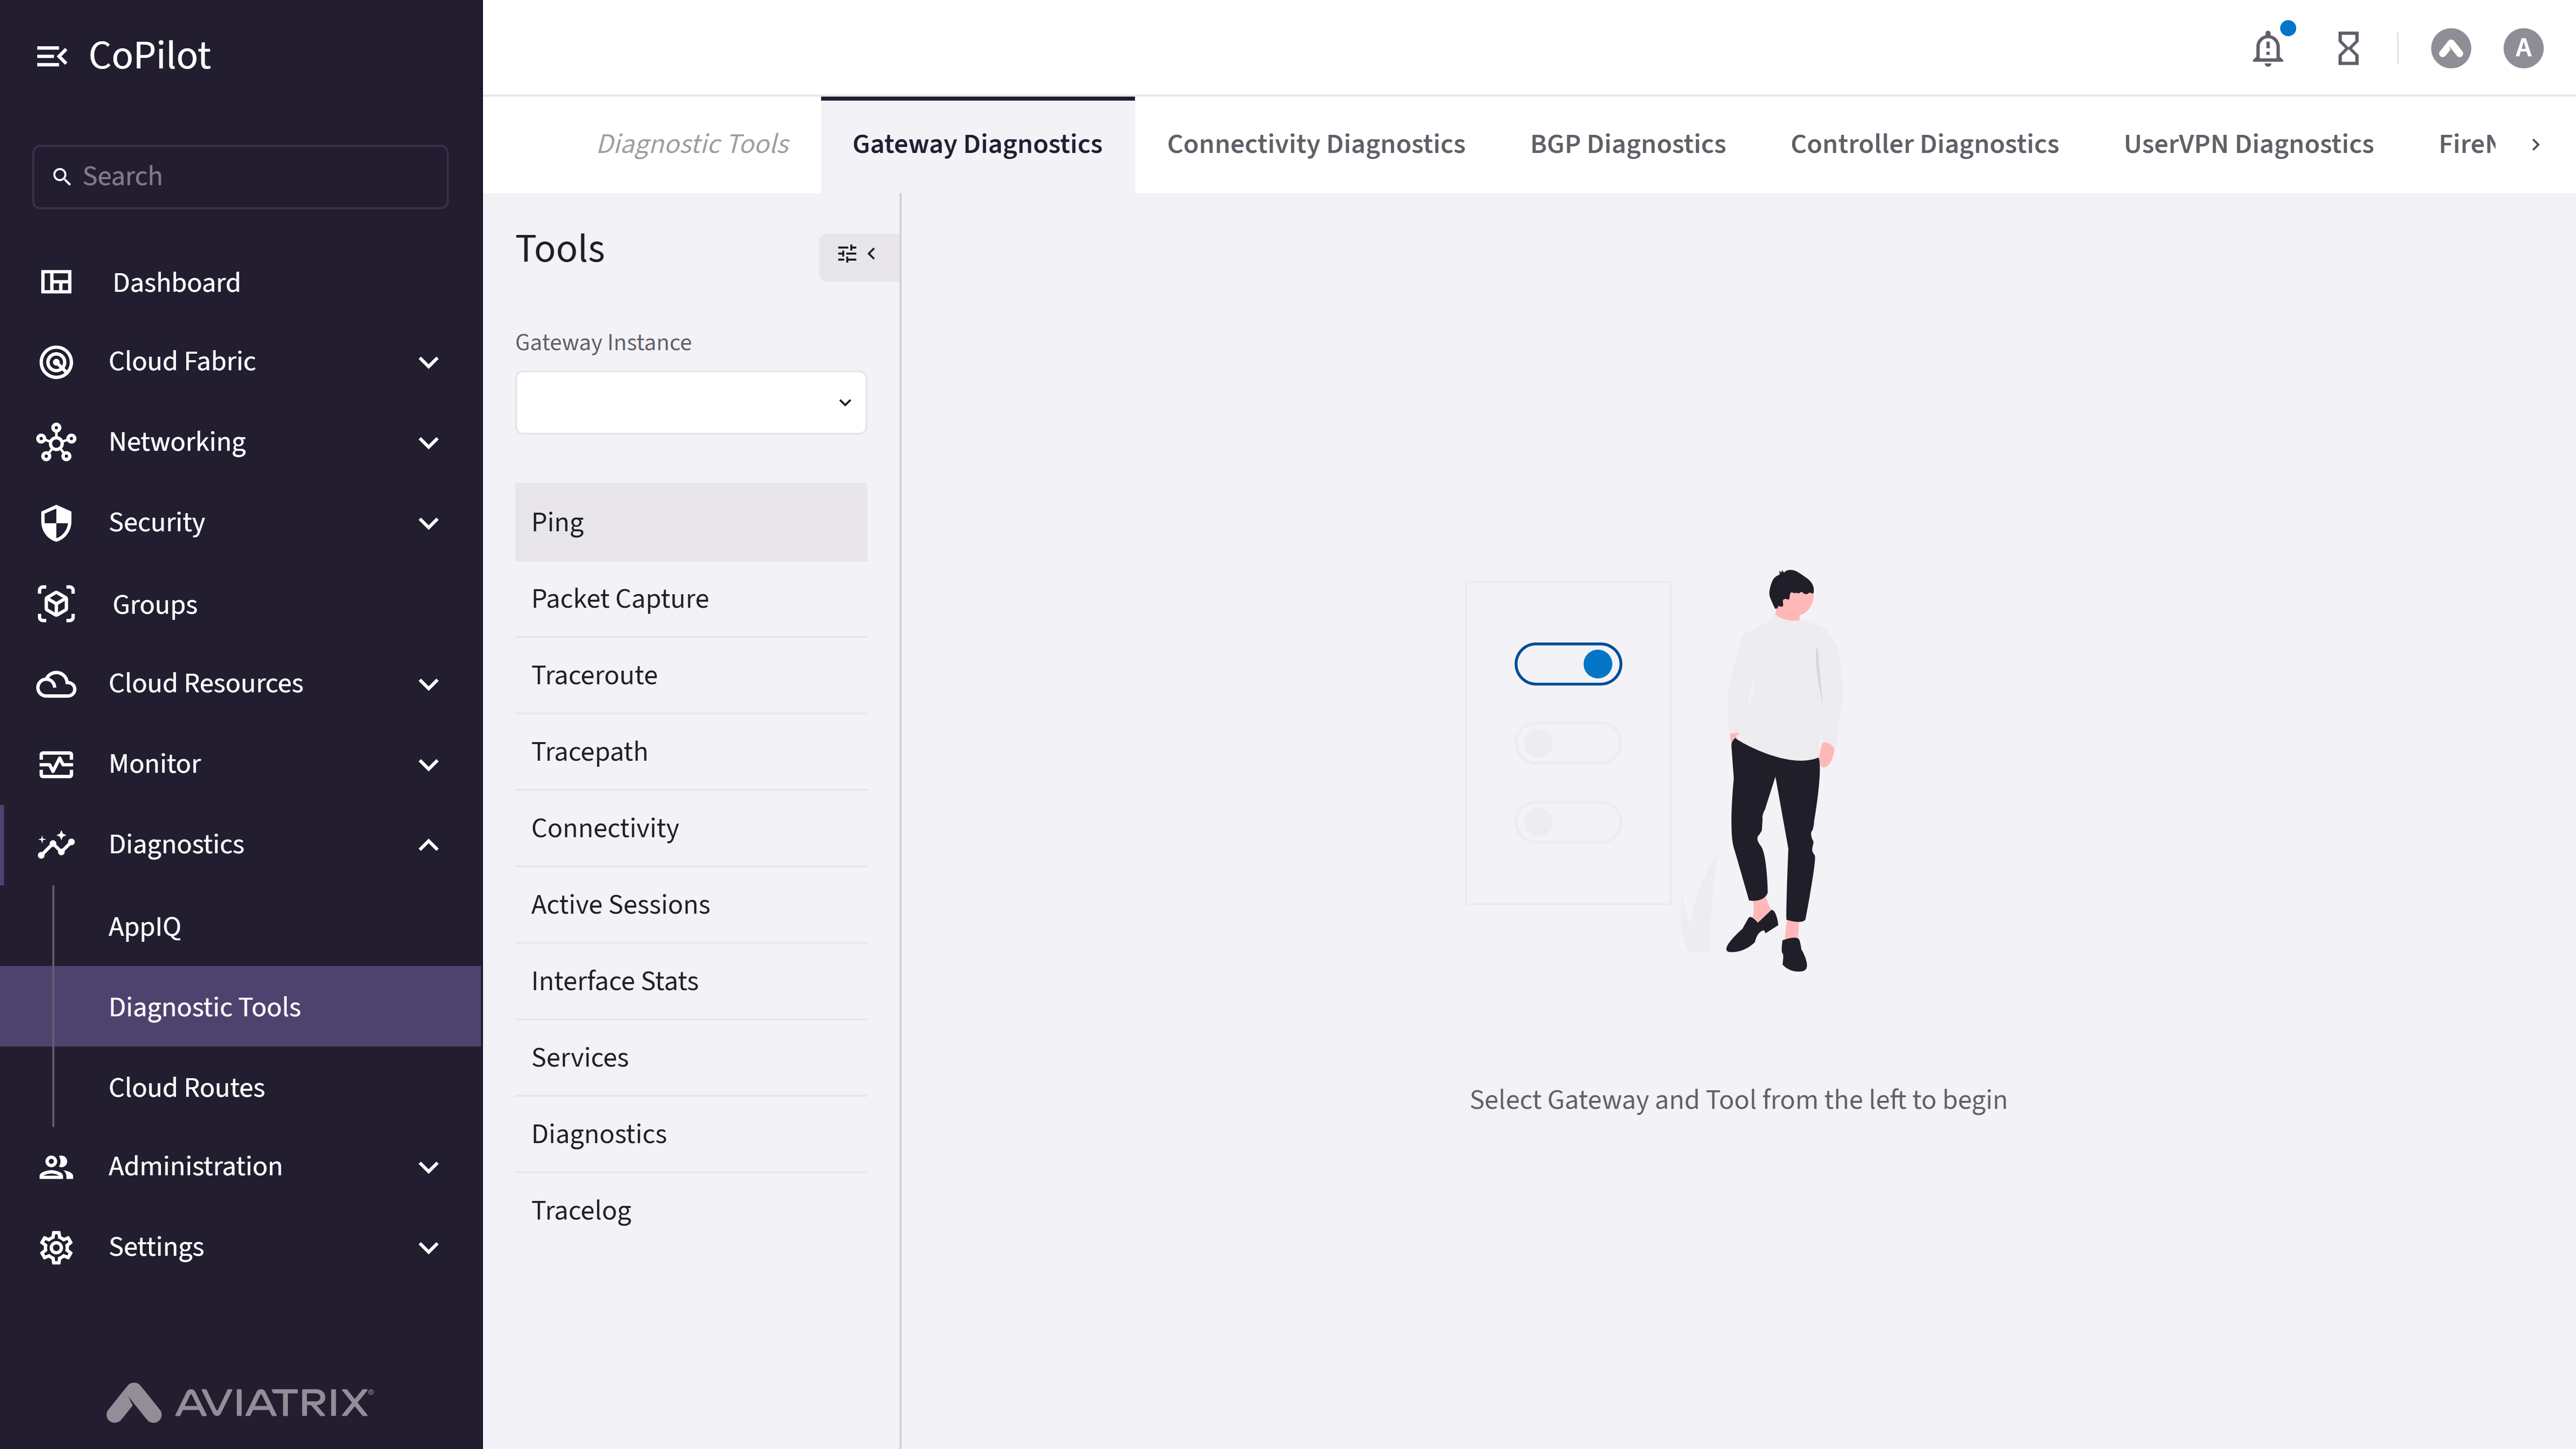
- Ping, Packet Capture, Traceroute, Tracepath, and Connectivity sub-tabs or tools, each with run controls and results panels for testing reachability and paths.
- Active Sessions, Interface Stats, Services, Diagnostics, and Tracelog sub-tabs or tools, each with run/refresh controls and results panels for viewing gateway status and history.
- Capability Audit For group: Symmetric Routing and AZ Affinity audit tools. Selecting either tool disables the Gateway Instance selector, since each tool selects its own gateway or gateway group scope.
Actions
Network Test Tools
Network Test Tools
Run Ping
Run Ping
To test gateway reachability with ping:
- Go to Diagnostics > Diagnostic Tools > Gateway Diagnostics.
Select the Ping tab. - Select Interface (default: Use Route Table) and enter Destination (IP / Host Name).
- Click Run to start the ping test. Use Reset to clear the form.
- Review the Results panel for reachability and round-trip time.
Parameter Details
Run Packet Capture
Run Packet Capture
To capture packets on a gateway interface:
- Go to Diagnostics > Diagnostic Tools > Gateway Diagnostics.
Select the Packet Capture tab. - Set Interface, IP / Host Name, Port, Duration, and Packet Length as needed. Click Run.
- Use Download PCAP File to save captured packets. Optionally, use Filter, Columns, Export, or Search on the packet table.
Run Traceroute
Run Traceroute
To trace the path from the gateway to a target:
- Go to Diagnostics > Diagnostic Tools > Gateway Diagnostics.
Select the Traceroute tab. - Select Interface and enter Destination (IP/Host Name). Click Run.
- Review the Results panel for hop details (IP, hostname, time). Use Reset to clear.
Run Tracepath
Run Tracepath
To check path and MTU to a target:
- Go to Diagnostics > Diagnostic Tools > Gateway Diagnostics.
Select the Tracepath tab. - Select Interface and enter Destination (IP/Host Name). Click Run.
- Review the Results panel for path and MTU details. Use Reset to clear.
Run Connectivity Test
Run Connectivity Test
To check reachability for common services:
- Go to Diagnostics > Diagnostic Tools > Gateway Diagnostics.
Select the Connectivity tab. - Enter HostName, Port, and select Protocol (TCP/UDP). Click Run.
- Review the Results panel for DNS, HTTPS, and IP reachability. Use Reset to clear.
Gateway Status Tools
Gateway Status Tools
View Active Sessions
View Active Sessions
To view live traffic sessions on the gateway:
- Go to Diagnostics > Diagnostic Tools > Gateway Diagnostics.
Select the Active Sessions tab. - Click Run to retrieve the latest active session data for the selected gateway.
View Interface Stats
View Interface Stats
To view real-time interface counters:
- Go to Diagnostics > Diagnostic Tools > Gateway Diagnostics.
Select the Interface Stats tab. - Review the Interface table (packets, errors) and Graph view (bandwidth).
View Gateway Services
View Gateway Services
To view gateway service status:
- Go to Diagnostics > Diagnostic Tools > Gateway Diagnostics.
Select the Services tab. - Review the Service list. Use Restart for a service if supported.
Run Gateway Diagnostics
Run Gateway Diagnostics
To run built-in gateway diagnostic checks:
- Go to Diagnostics > Diagnostic Tools > Gateway Diagnostics.
Select the Diagnostics tab. - Optionally toggle Include Controller to include Controller-side checks.
- Click Run to start tests, or use its dropdown to Show Last Diagnostics Result or Submit To Support instead.
- Review the output console for findings.
Download Tracelog
Download Tracelog
To collect and download gateway logs:
- Go to Diagnostics > Diagnostic Tools > Gateway Diagnostics.
Select the Tracelog tab. - Review the Log list and click Download to save the selected log file.
Capability Audit
Capability Audit
Run Symmetric Routing Audit
Run Symmetric Routing Audit
To audit spoke gateways for symmetric routing issues:
- Go to Diagnostics > Diagnostic Tools > Gateway Diagnostics.
Under Capability Audit For, select Symmetric Routing. - Click Run. The tool audits every spoke gateway group with Symmetric Routing enabled (no gateway selection is required). Use Cancel to stop an in-progress run, or Reset to clear the results.
- Review the summary (Status, Gateways Audited, Gateways Passed, Gateways with Issues) and the Gateways with Issues section for route-table-level findings and remediation guidance.
Parameter Details
Run AZ Affinity Audit
Run AZ Affinity Audit
To audit a pair of peered gateway groups for AZ affinity issues:
- Go to Diagnostics > Diagnostic Tools > Gateway Diagnostics.
Under Capability Audit For, select AZ Affinity. - Select Gateway Group 1, then select Gateway Group 2 from the gateway groups peered with it (AWS only).
- Click Run. Use Reset to clear the selections and results.
- Review the findings, or the success message if no issues are found.