

- Traffic
- Latencies
Purpose
The Traffic page displays network traffic metrics for selected time periods. Use the View Selector to switch between Regions, VPC/VNets, Gateways, and Instances views.Elements
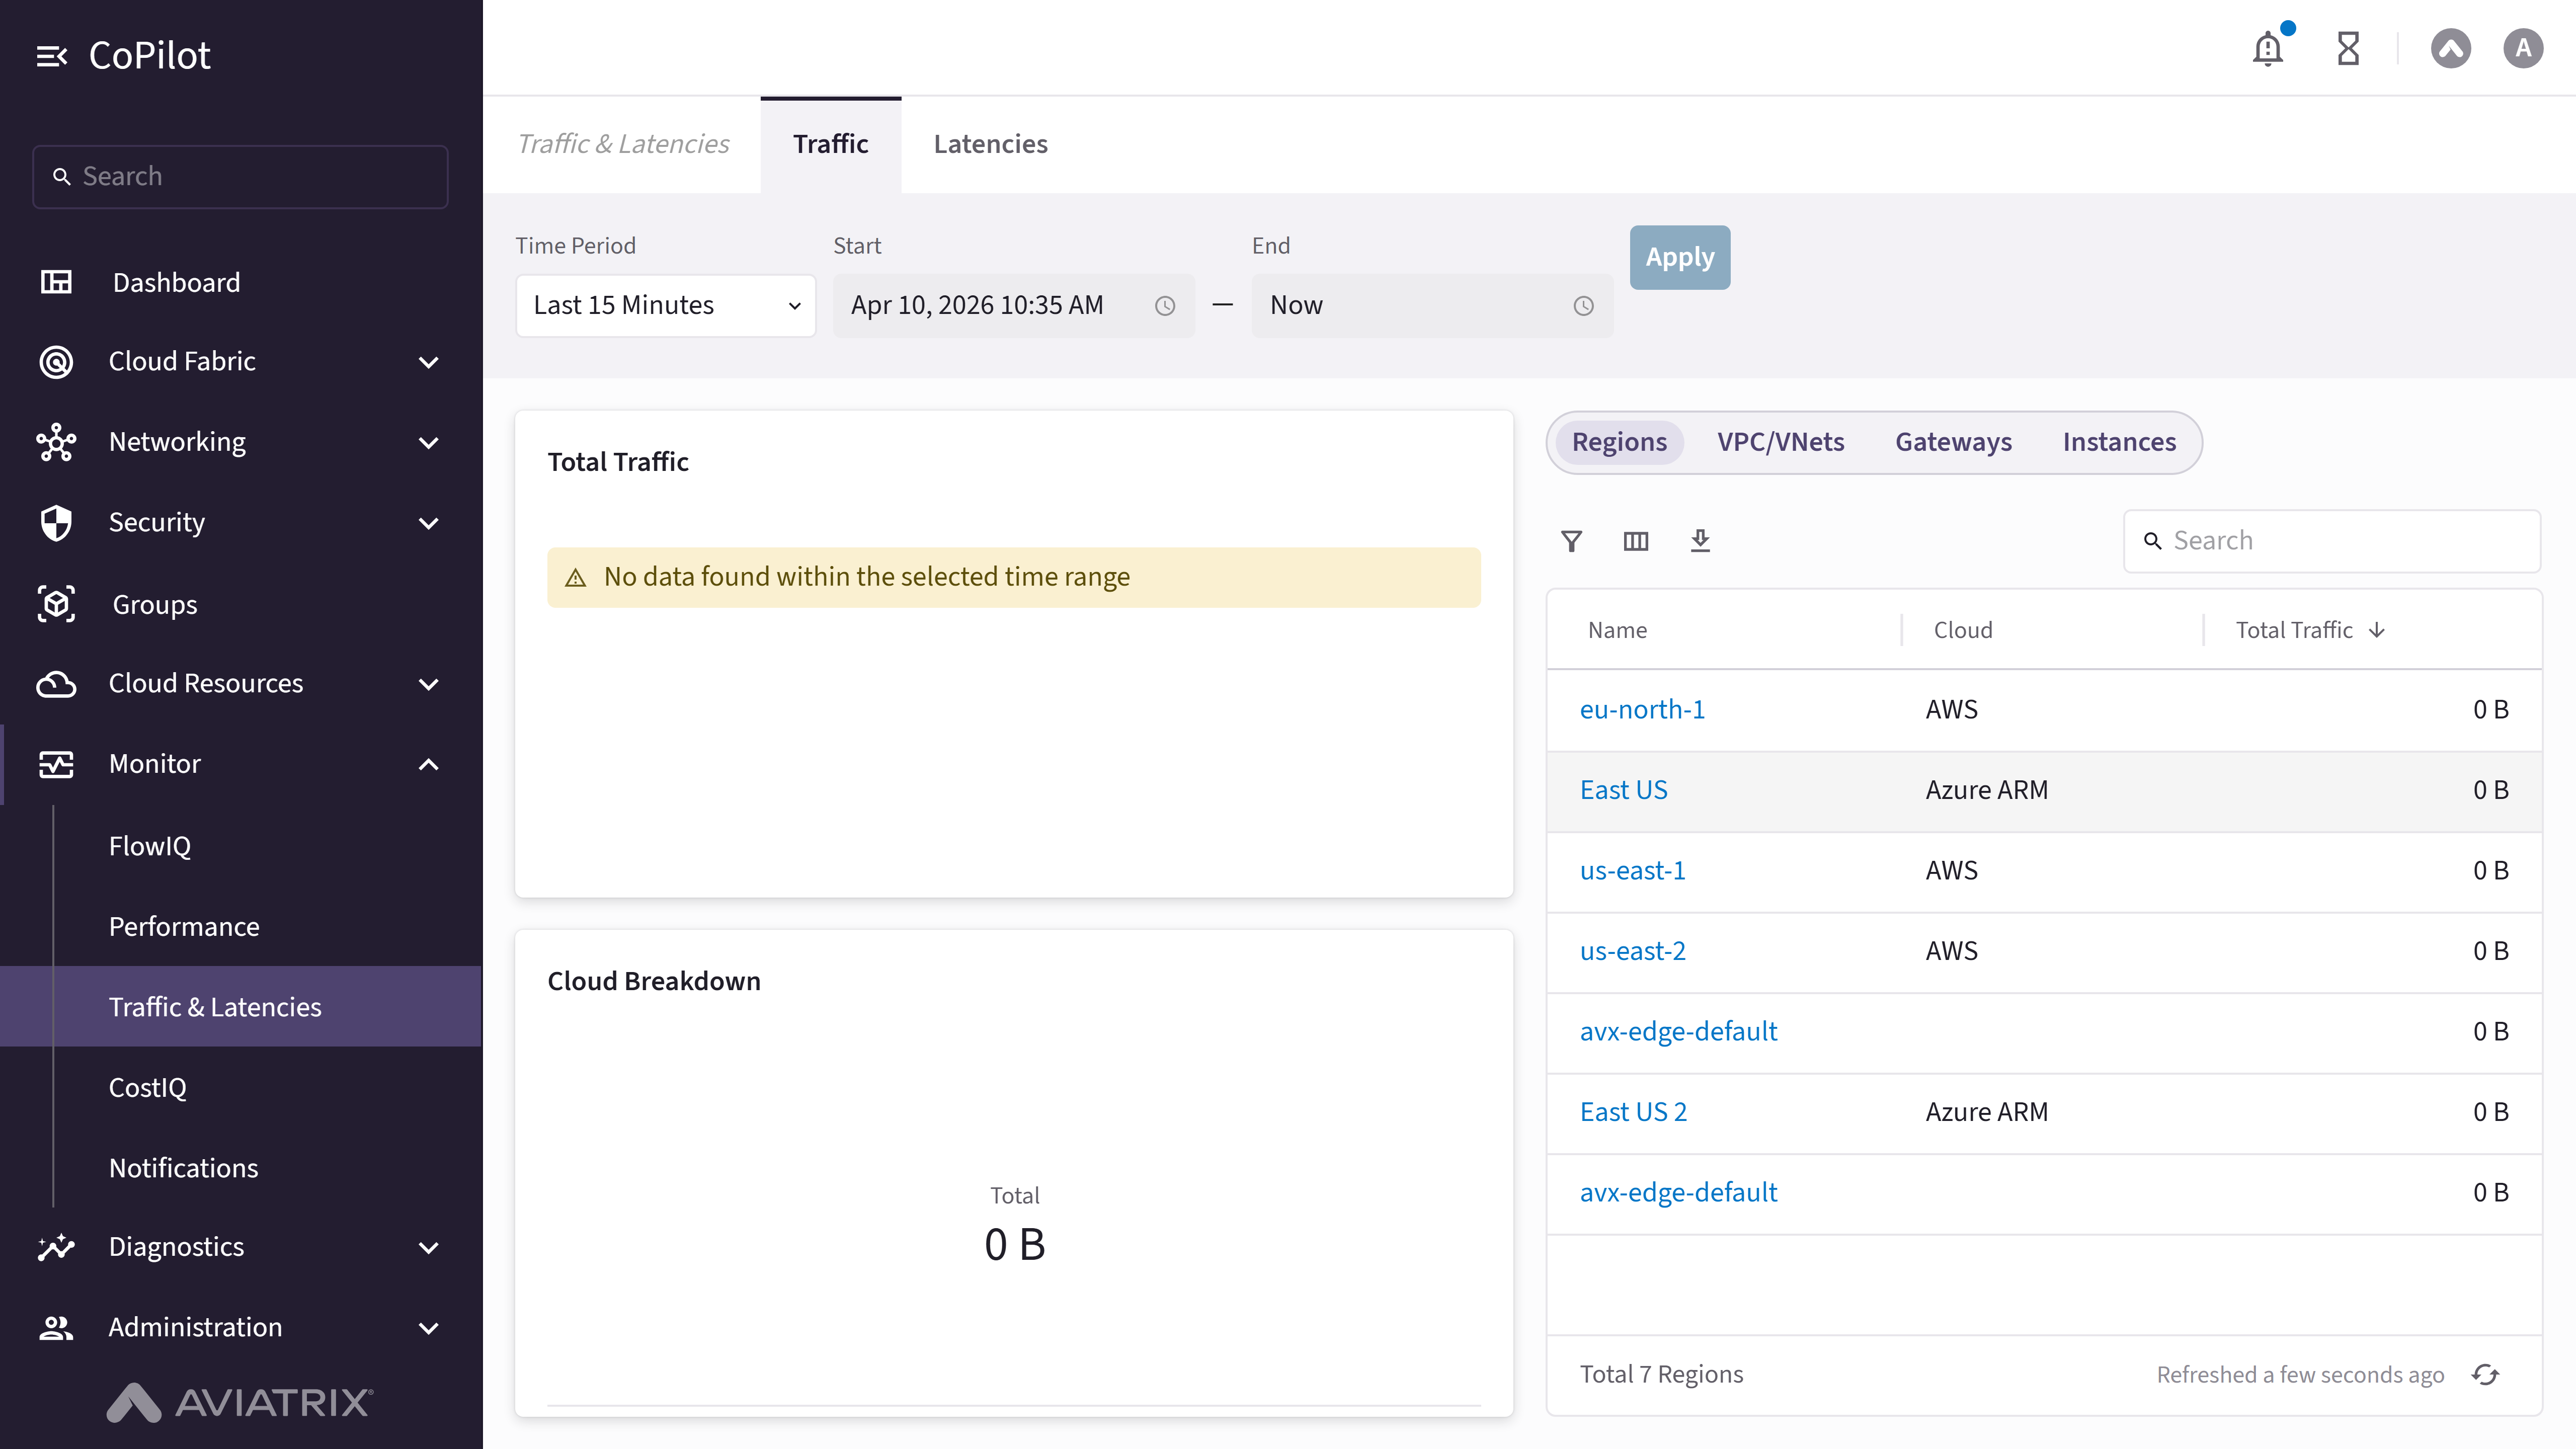
- Time Period: Dropdown to select time period (e.g., Last 15 Minutes).
- Start: Date and time picker for start time.
- End: Date and time picker for end time (can be set to ‘Now’).
- Apply button: Applies selected filters and displays traffic data.
- Data Integrity and Traffic panel: Dismissible expandable panel (shown on Controller 7.2 and later, until dismissed) noting that traffic data may be extrapolated from the configured NetFlow sampling rate, with a NetFlow Settings button that navigates to the NetFlow sampling configuration.
- Total Traffic: Card displaying a total traffic line chart for the selected time period.
- Cloud Breakdown: Card displaying a donut chart of traffic broken down by cloud provider.
- View Selector: Buttons to switch between Regions, VPC/VNets, Gateways, and Instances views.
- Name: Link in each table row that opens a Traffic: [name] dialog showing a Time Period picker, View in Topology and View in FlowIQ buttons, a Total Traffic card (or Sent/Received/Total cards on the Instances view), and a traffic-over-time area chart.
- Search: Search box for filtering table content.
- Show filters button: Opens filter dialog to filter table data.
- Select columns button: Opens column selection dialog.
- Export button: Exports traffic data.
- Refresh button: Refreshes traffic data.
Actions
View Traffic by Region
View Traffic by Region
To view traffic metrics by region:
- Go to Monitor > Traffic & Latencies > Traffic.
- Use Time Period, Start, and End to set the time range. Click Apply.
- In the View Selector, select Regions.
- Review Total Traffic and Cloud Breakdown and the regions table. Optionally, use Search, Show filters, Select columns, Export, or Refresh.
View Traffic by VPC/VNet
View Traffic by VPC/VNet
To view traffic metrics by VPC/VNet:
- Go to Monitor > Traffic & Latencies > Traffic.
- Use Time Period, Start, and End to set the time range. Click Apply.
- In the View Selector, select VPC/VNets.
- Review the VPC/VNets table. Optionally, use Search, Show filters, Select columns, Export, or Refresh.
View Traffic by Gateway
View Traffic by Gateway
To view traffic metrics by gateway:
- Go to Monitor > Traffic & Latencies > Traffic.
- Use Time Period, Start, and End to set the time range. Click Apply.
- In the View Selector, select Gateways.
- Review the gateways table. Optionally, use Search, Show filters, Select columns, Export, or Refresh.
View Traffic by Instance
View Traffic by Instance
To view traffic metrics by instance:
- Go to Monitor > Traffic & Latencies > Traffic.
- Use Time Period, Start, and End to set the time range. Click Apply.
- In the View Selector, select Instances.
- Review the instances table (Sent, Received, Total Traffic). Optionally, use Search, Show filters, Select columns, Export, or Refresh.
Parameter Details
View Traffic Detail for a Row
View Traffic Detail for a Row
To view detailed traffic data for a region, VPC/VNet, gateway, or instance:
- Go to Monitor > Traffic & Latencies > Traffic.
- In any view, click the Name link for a row.
- The Traffic: [name] dialog appears. Use its own Time Period picker to change the range.
- Optionally, click View in Topology to locate the item in the topology map, or View in FlowIQ to view related flow records.
- Click Close to dismiss the dialog.
