- Overview
- Trends
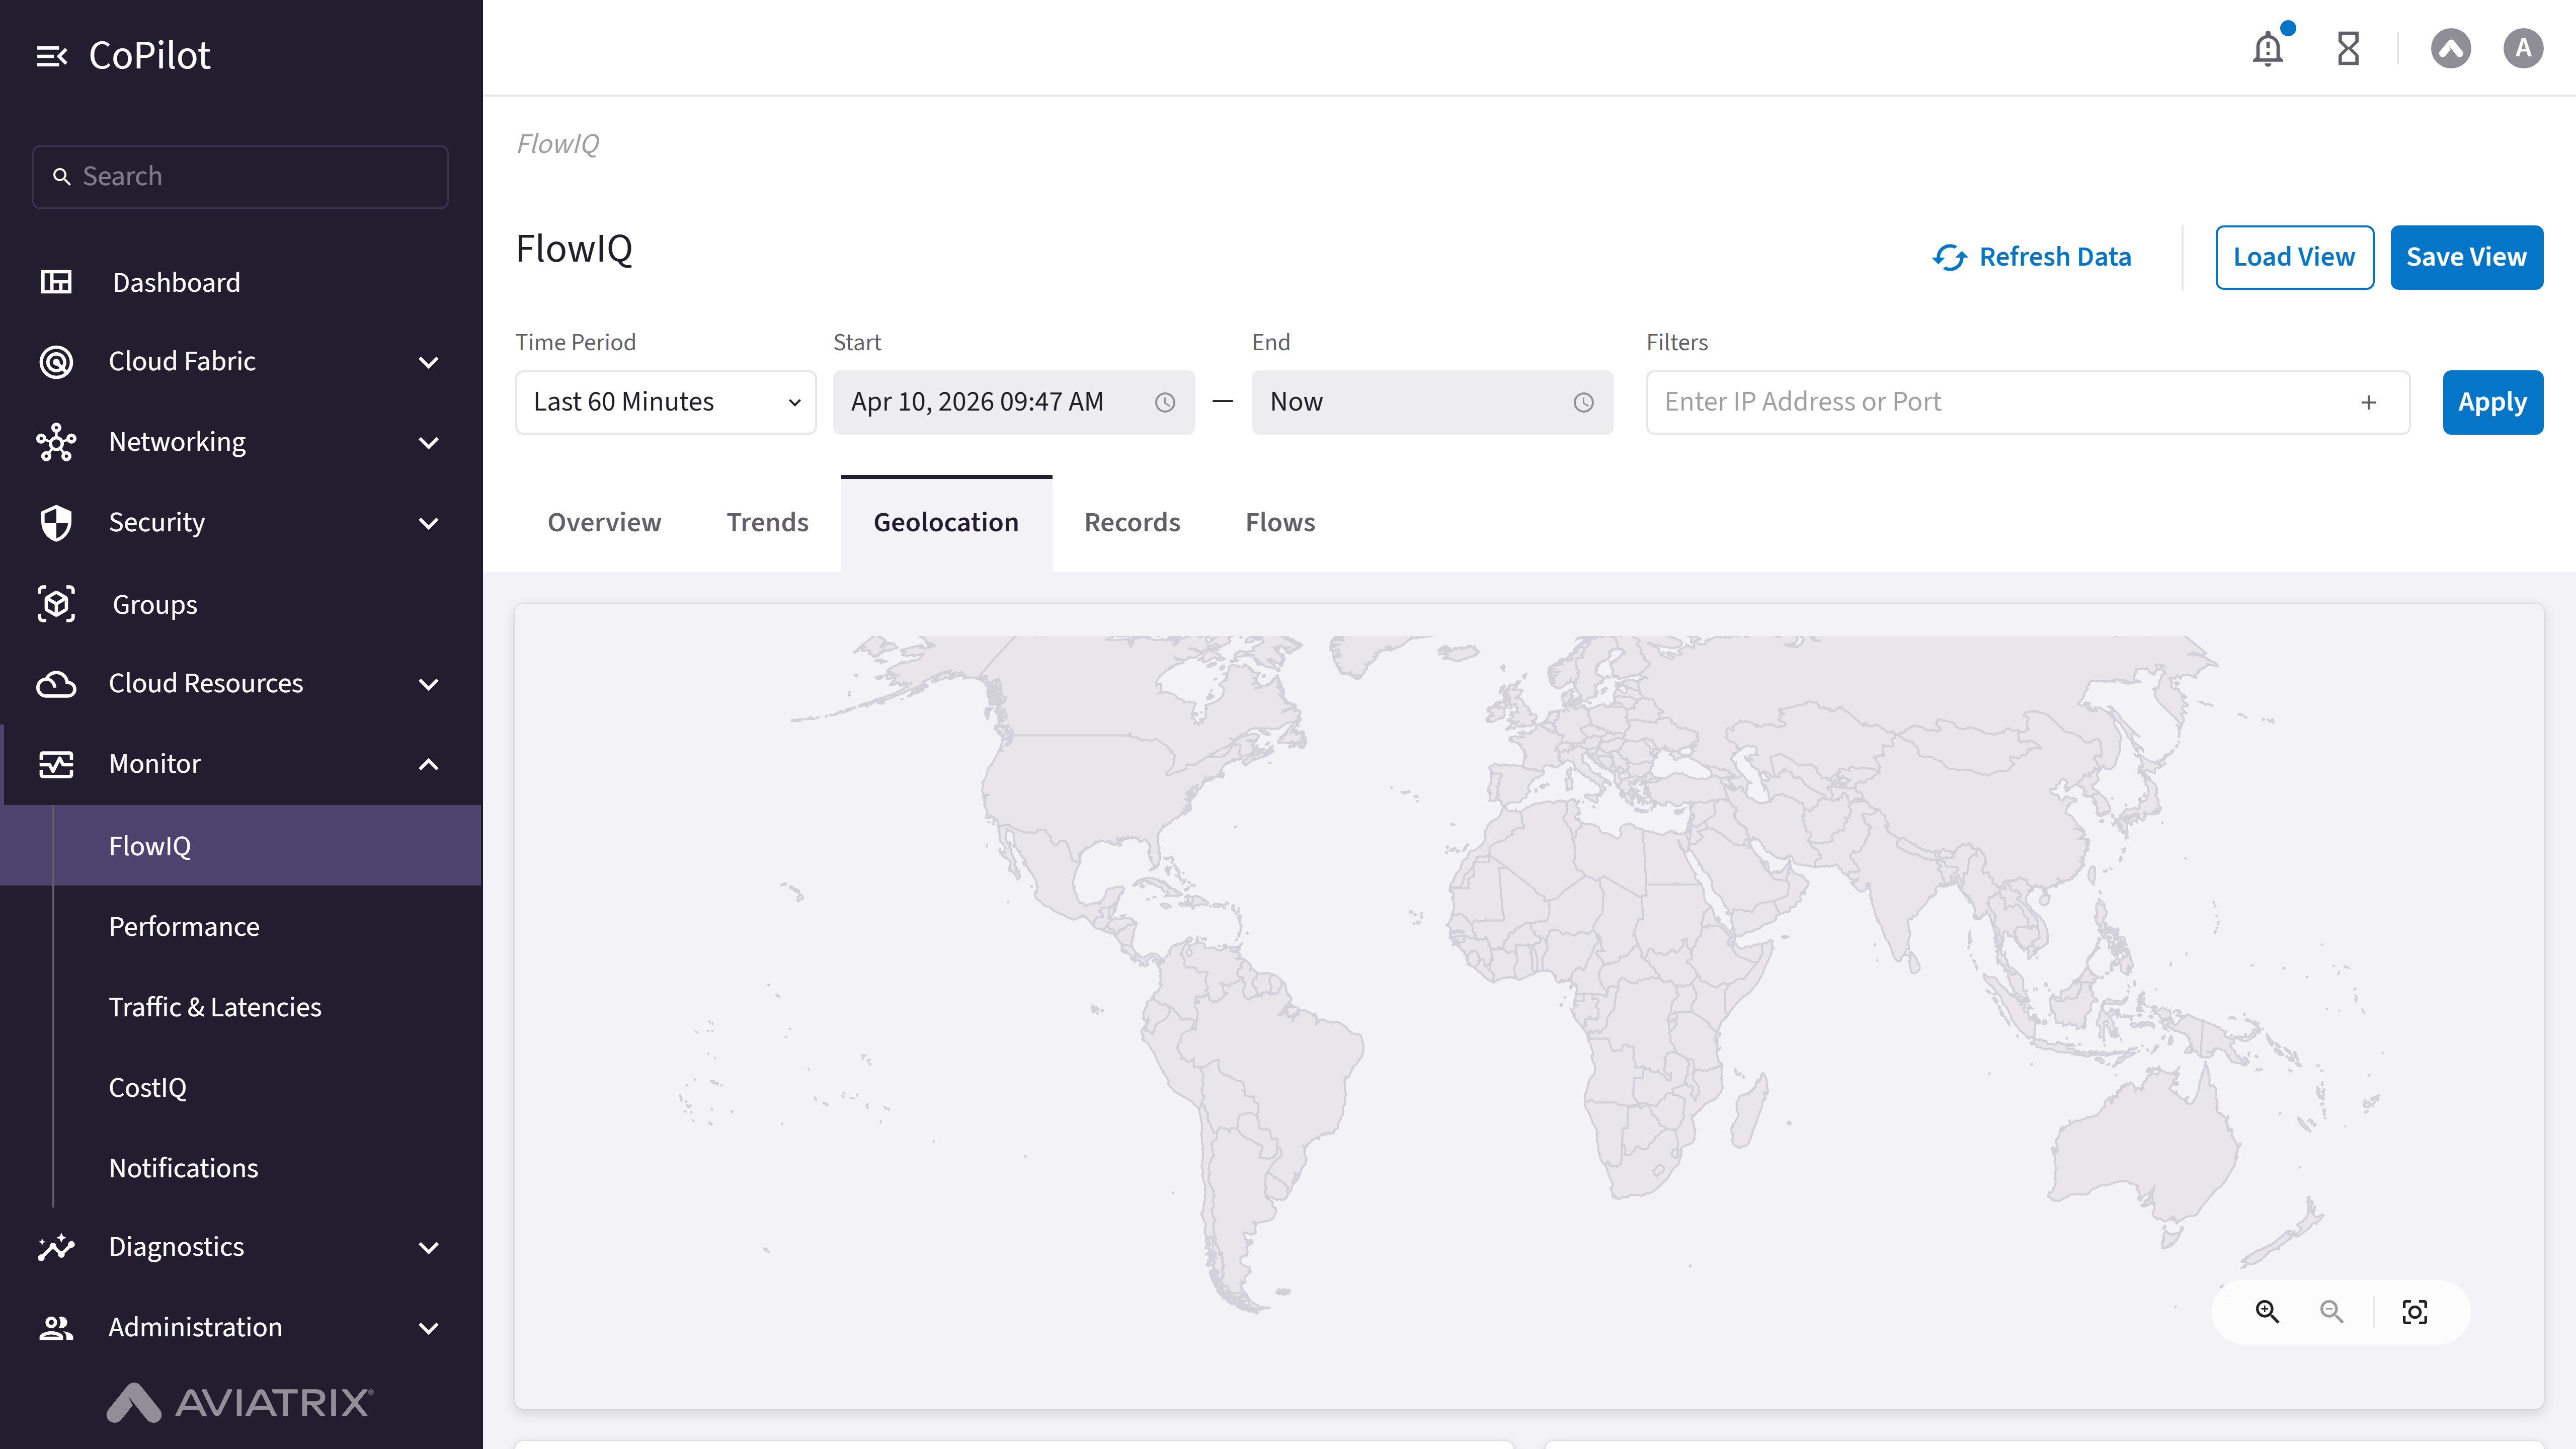
- Geolocation
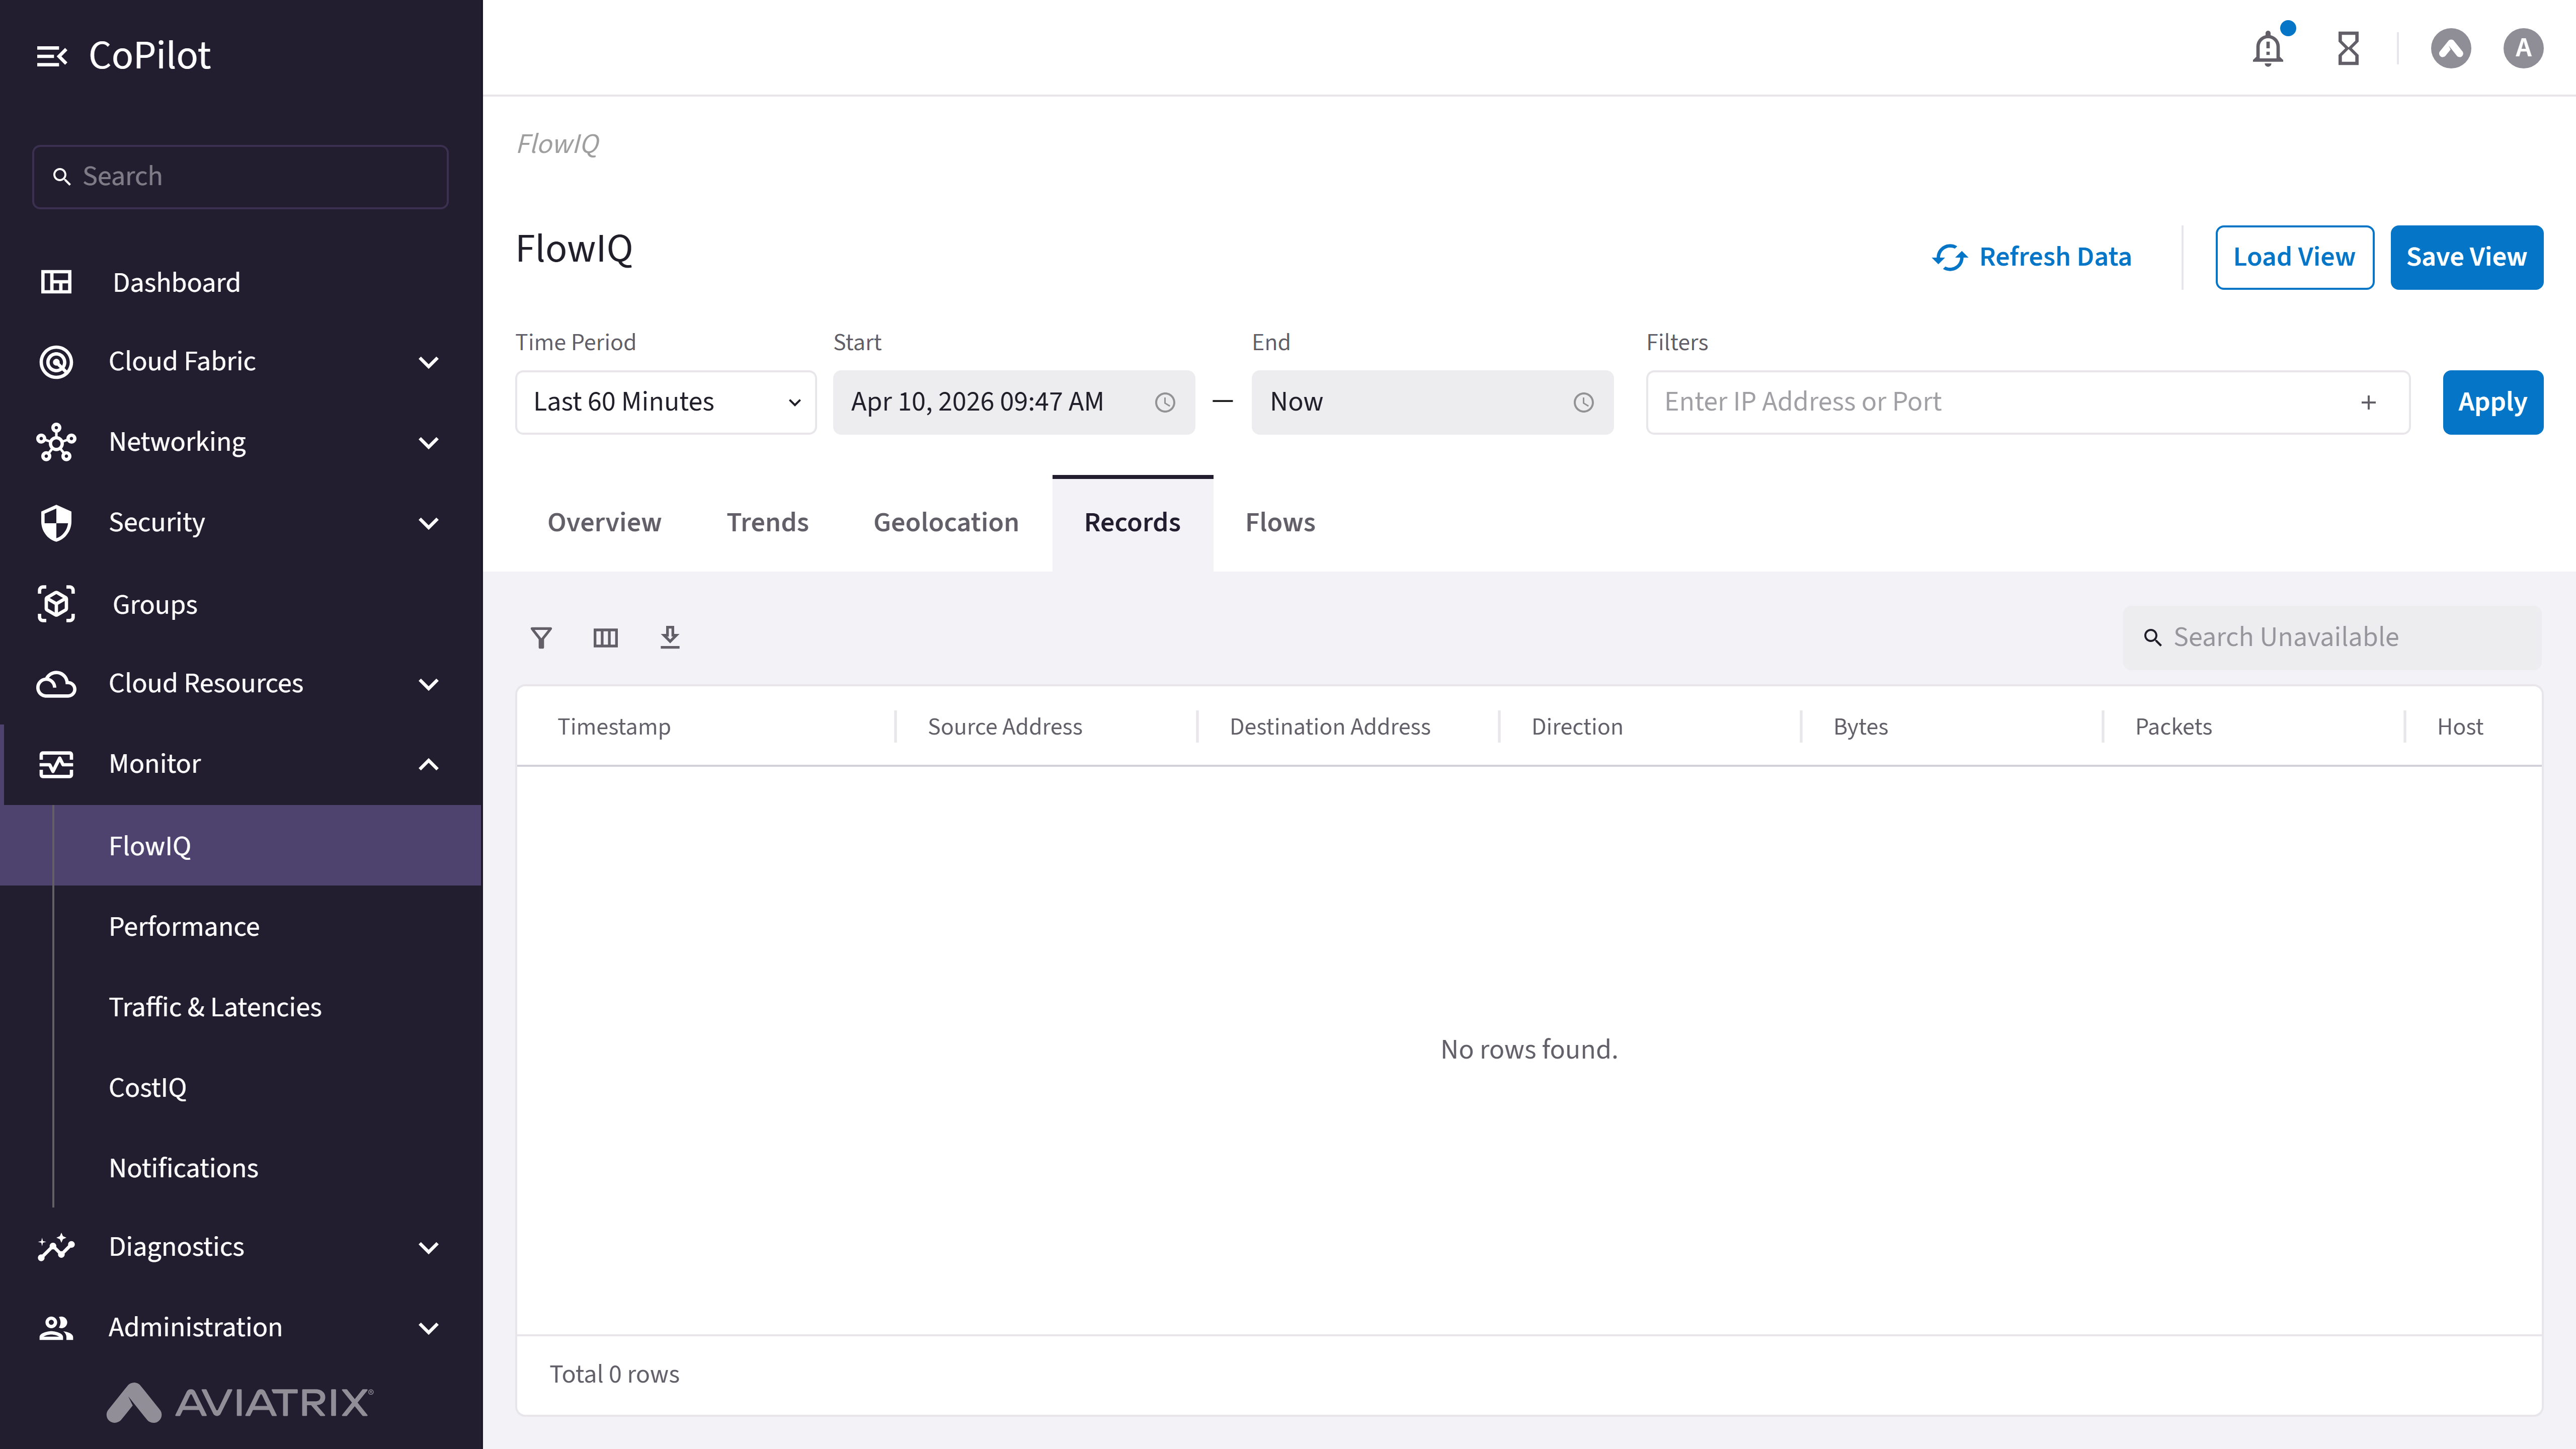
- Records
- Flows
Purpose
The Overview page displays network flow data analysis with traffic metrics, source and destination IP visualizations, and flow statistics for the selected time period.Elements
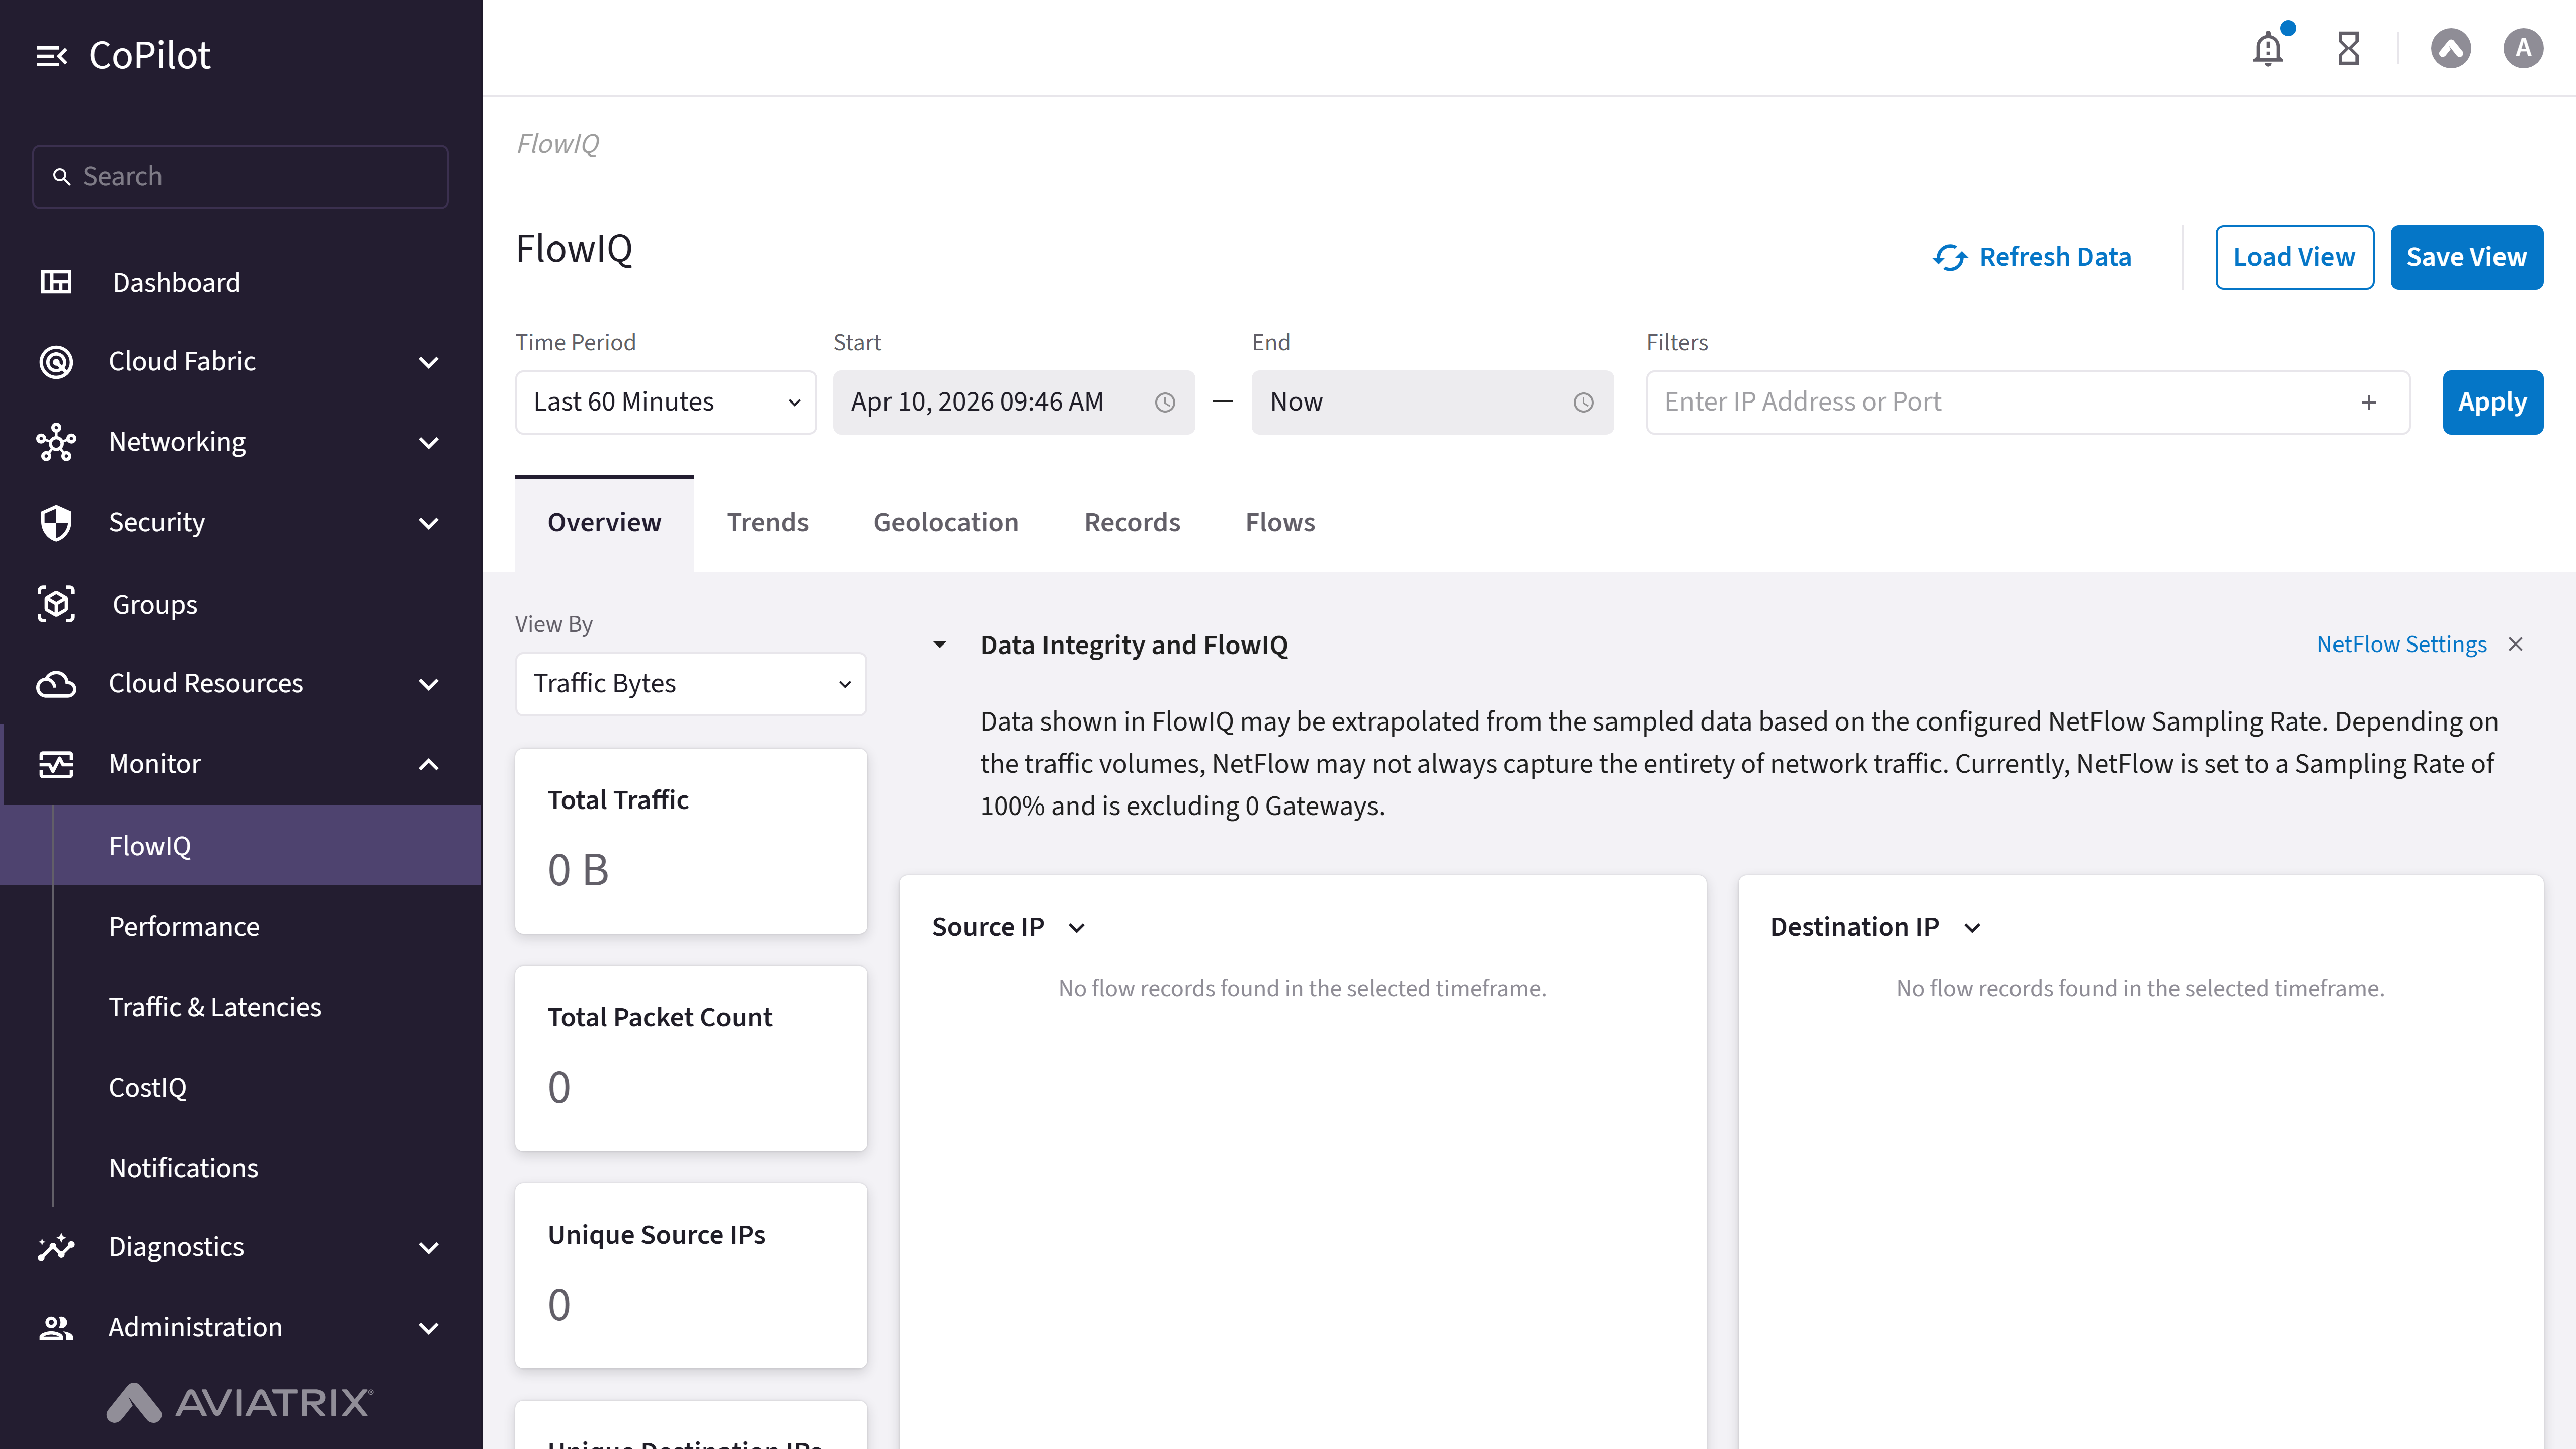
- Time Period: Dropdown to select time period (e.g., Last 60 Minutes).
- Start: Date and time picker for start time.
- End: Date and time picker for end time (can be set to ‘Now’).
- Enter IP Address or Port: Filter input for IP address or port.
- Refresh Data: Button to refresh the displayed data.
- Load View: Button to load a saved view configuration.
- Save View: Button to save the current view configuration.
- Apply: Button to apply the selected filters and time period.
- View By: Dropdown to select view metric (e.g., Traffic Bytes).
- Total Traffic: Card displaying total traffic metric.
- Total Packet Count: Card displaying total packet count metric.
- Unique Source IPs: Card displaying unique source IPs count.
- Unique Destination IPs: Card displaying unique destination IPs count.
- Source IP: Chart showing top source IPs by the selected View By metric. Use the chart title dropdown to switch between Source IP and Source Host.
- Destination IP: Chart showing top destination IPs by the selected View By metric. Use the chart title dropdown to switch between Destination IP and Destination Host.
- Source Port: Chart/visualization for source port data.
- Destination Port: Chart/visualization for destination port data.
- IP Version and Protocol: Chart/visualization for IP version and protocol data.
- Autonomous Systems: Chart showing top autonomous systems by the selected View By metric.
- Flow Exporters: Chart showing top flow exporters (gateways sending NetFlow data) by the selected View By metric.
- Flow Locality: Chart showing traffic breakdown by flow locality by the selected View By metric.
- Data Integrity and FlowIQ: Expandable information panel about NetFlow sampling rate and data integrity.
- NetFlow Settings: Button that navigates to NetFlow configuration settings.
Actions
View FlowIQ Overview
View FlowIQ Overview
To view FlowIQ flow data and metrics:
- Go to Monitor > FlowIQ > Overview.
- The Overview page appears with Total Traffic, Total Packet Count, Unique Source IPs, and Unique Destination IPs cards and visualizations.
- Use Time Period, Start, and End to set the time range, and Enter IP Address or Port to filter. Click Apply.
- Optionally, use View By, Source IP, Destination IP, Source Port, Destination Port, IP Version and Protocol, Autonomous Systems, Flow Exporters, or Flow Locality to change visualizations.
- Optionally, use Load View or Save View to manage view configurations, Refresh Data to refresh, or NetFlow Settings to open NetFlow configuration.