

- Overview
- Transit Gateways
- Spoke Gateways
- Specialty Gateways
- Gateway Management
- Settings
Purpose
The Overview page shows Aviatrix-managed and Aviatrix-unmanaged Gateways, their health status, their CPU and RAM usage, and connectivity details across multiple clouds and edge sites.Elements
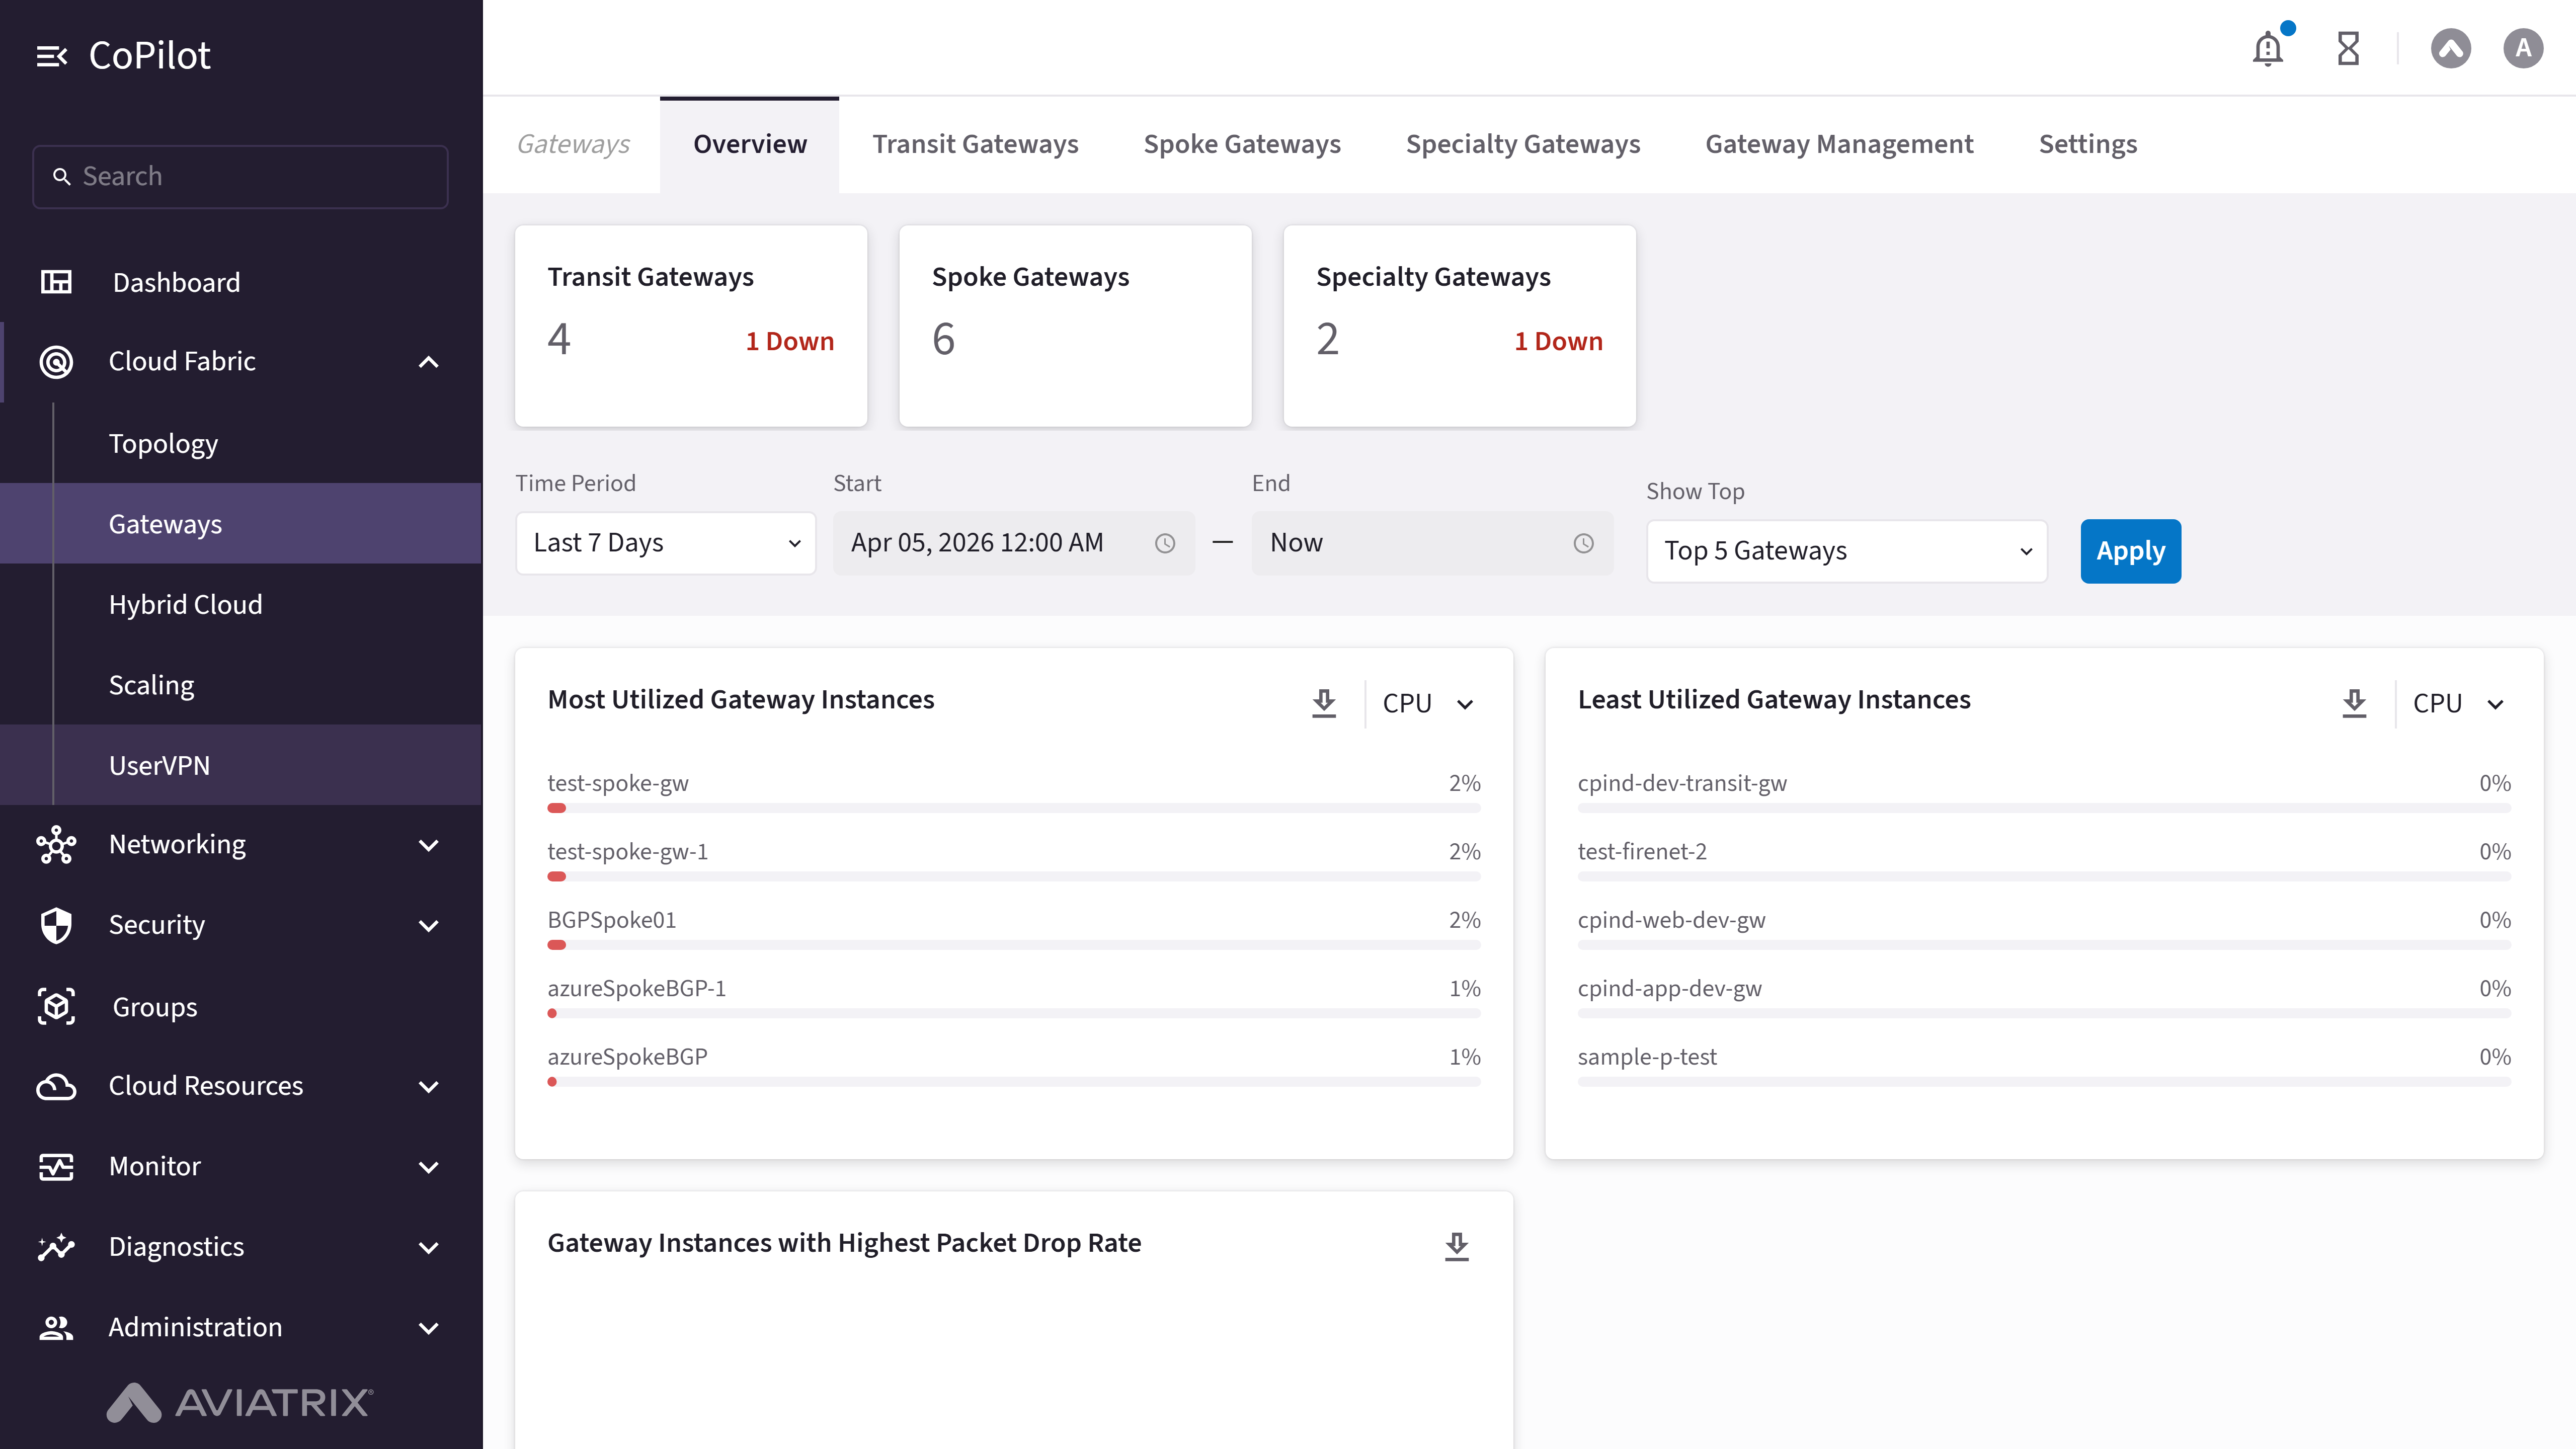
- Gateways count: Shows the count of Transit, Spoke, and Specialty Gateways.
- Filters: Filters the list of top 5, 10, 20, 50, or 100 Gateway instances based on the selected time period to view their usage metrics.
- Most Utilized Gateway Instances: Shows the list of Gateway instances with the most CPU or memory usage.
- Least Utilized Gateway Instances: Shows the list of Gateway instances with the least CPU or memory usage.
- Gateway Instances with Highest Packet Drop Rate: Shows the list of Gateway instances with the highest packet drop rate.
Actions
View Overview
View Overview
- Go to Cloud Fabric > Gateways > Overview.
The Overview page appears with Gateway counts (Transit, Spoke, Specialty), usage filters, and cards for most utilized, least utilized, and highest packet drop rate Gateways. - Optionally, use Time Period Selector, Start Date Field, End Date Field, and Show Top Dropdown to narrow the time range and number of Gateways.
- Click Apply to update the view.
- Optionally, click the download icon at the top-right of a card to download the metrics data for that card.
Parameter Details
| CoPilot Parameter Name | Description |
|---|---|
| Transit Gateways | Shows the total number of Transit Gateways and indicates how many are down. |
| Spoke Gateways | Shows the total number of Spoke Gateways and indicates how many are down. |
| Specialty Gateways | Shows the total number of Specialty Gateways and indicates how many are down. |
| Time Period | Dropdown to select the time range for Gateway usage metrics (e.g., Last 7 Days). |
| Start | Field to specify the start date for the selected time period. Set Time Period to Custom to enable this field. |
| End | Field to specify the end date for the selected time period. Set Time Period to Custom to enable this field. |
| Show Top | Dropdown to select the number of top Gateways to display based on usage. |
| Most Utilized Gateway Instances | Shows Gateways with the highest CPU or memory usage during the selected time period. |
| Least Utilized Gateway Instances | Shows Gateways with the lowest CPU or memory usage during the selected time period. |
| Gateway Instances with Highest Packet Drop Rate | Shows Gateways experiencing the highest packet drop rate. |
Purpose
The Transit Gateways page lets you view the list of configured Transit Gateways and their details.A Transit Gateway is a core component of the Aviatrix Cloud Networking Platform that acts as a centralized hub in a hub-and-spoke topology. It enables connectivity between Spoke VPCs and VNets and on-premises data centers across AWS, Azure, Google Cloud, and Oracle Cloud.You can attach Transit Gateways to other Transit Gateways or Spoke Gateways over private or public networks with High Performance Encryption (HPE), and attach Azure Transit Gateways to Azure VNets through Native Peering.Elements
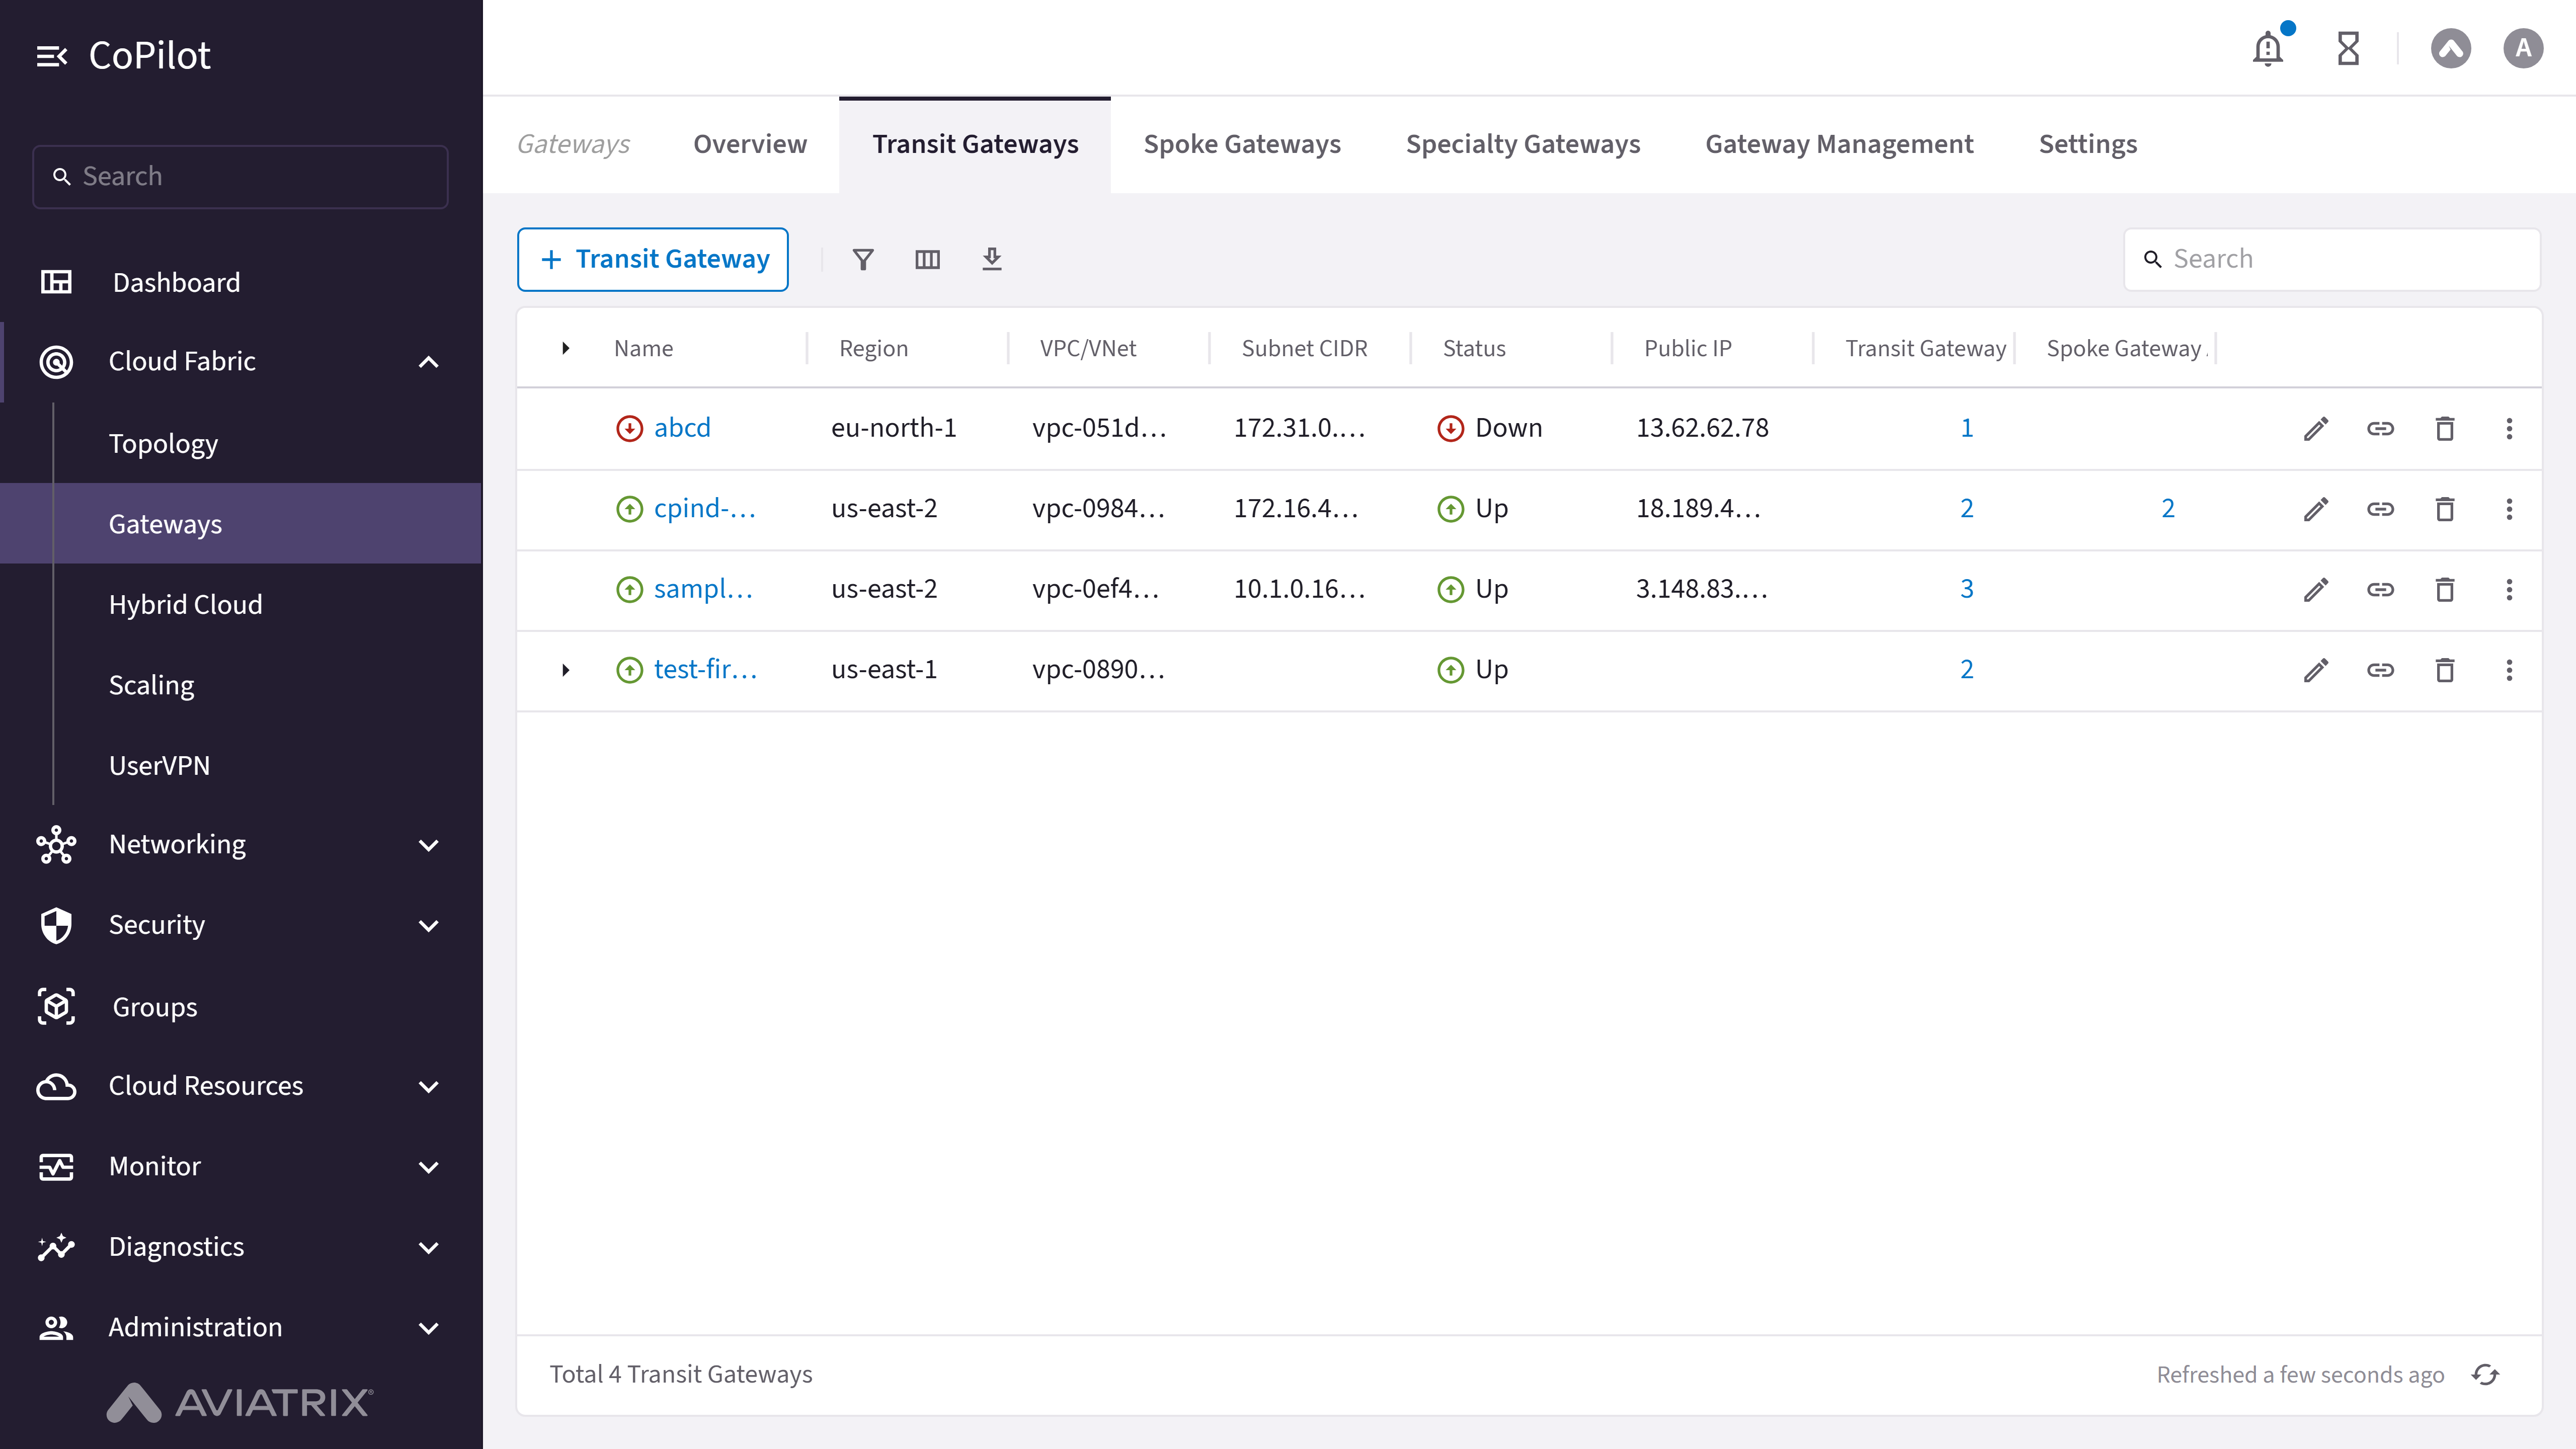
- + Transit Gateway button: Initiates the workflow to create a new Transit Gateway.
- Transit Gateway table: Shows the details for each Transit Gateway (cloud, account, region, VPC/VNet, status, attachments).
- Edit button: Edits the Transit Gateway configuration (instance size, IPv6, peering, BGP over LAN, HA instances).
- Manage Gateway Attachments button: Adds or removes Transit and Spoke Gateway attachments.
- Delete button: Deletes the Transit Gateway along with all of its instances and attachments.
- Actions button: Opens Gateway Diagnostics, Connectivity Diagnostics, BGP Diagnostics, and Resize Gateway.
- Gateway name link: Opens the Transit Gateway Details page with tabs for Details, Instances, Attachments, VPC/VNet Route Tables, Gateway Routes, Interface Stats, Route DB, Performance, and Settings.
Actions
Configure Transit Gateway
Configure Transit Gateway
View Transit Gateways
View Transit Gateways
- Go to Cloud Fabric > Gateways > Transit Gateways.
The Transit Gateways page appears with a table of Transit Gateways. - Click a Transit Gateway name to view its details.
- Optionally, use the Search field or the Filter icon to find a Transit Gateway.
Parameter Details
| CoPilot Parameter Name | Description |
|---|---|
| Name | Shows the name of the Transit Gateway. |
| Cloud | Shows the cloud provider where the Transit Gateway runs, such as AWS, Azure, GCP, and OCI. |
| Account | Shows the cloud account under which the Transit Gateway runs. |
| Region | Shows the cloud region where the Transit Gateway runs. |
| VPC/VNet | Shows the Virtual Private Cloud or Virtual Network that the Transit Gateway uses. |
| VPC/VNet CIDR | Shows the CIDR block that defines the IP address range of the VPC or VNet. |
| Subnet ID | Shows the unique ID of the subnet that the Transit Gateway uses. |
| Subnet CIDR | Shows the CIDR block that defines the IP address range of the subnet. |
| Public IP | Shows the public IP address that the Transit Gateway uses for external traffic. |
| Private IP | Shows the private IP address that the Transit Gateway uses for internal traffic. |
| Instance size | Shows the compute size that runs the Transit Gateway. |
| Status | Shows the current state of the Transit Gateway, example: Up and Down. |
| Configuration Status | Shows whether the Gateway configuration is Latest or Outdated. |
| High Performance Encryption | Shows whether high performance encryption is enabled to secure traffic. |
| FIPS Mode | Shows whether FIPS 140-3 compliant encryption mode is enabled on the Transit Gateway (Controller 9.0 and later). |
| Transit Gateway Attachments | Shows the number of attached Transit Gateways. |
| Spoke Gateway Attachments | Shows the number of attached Spoke Gateways. |
| Actions | Shows the actions that can be performed on the Transit Gateway. |
Create a Transit Gateway
Create a Transit Gateway
- Go to Cloud Fabric > Gateways > Transit Gateways.
A table appears with the list of Transit Gateways. - Click + Transit Gateway.
The Create Transit Gateway dialog appears. - Click + Instance to create a new instance for a Highly Available (HA)
Transit Gateway.Note: A Transit Gateway supports up to 15 highly available gateway instances.
All gateway instances operate in an active-active state and continue forwarding traffic if a tunnel fails between a Transit VPC/VNet and Spoke VPC/VNet. - Provide the information. Refer to the Parameter Details table.
The Support for IPv6 option appears if the VPC/VNet supports IPv6.
- Click Save.
Parameter Details
| CoPilot Parameter Name | Description |
|---|---|
| Name | Enter a name for the Transit gateway. Ensure that the name:
|
| Cloud | Select the cloud provider where the Transit Gateway runs. |
| Account | Select the cloud account that creates the Transit Gateway. |
| Region | Select the cloud region where the Transit Gateway runs. |
| VPC | Select the VPC or VNet where the Transit Gateway runs. If the selected Transit gateway will be used in a Transit FireNet workflow, select a VPC/VNet that has the Transit + FireNet function enabled. This means that a particular set of /28 subnets has been created across two availability zones. This function is enabled when the VPC/VNet is created. |
| Instance Size | Select the compute size for the Transit Gateway based on the Instance Size Details section. Important:
|
| High Performance Encryption | Enable High Performance Encryption (HPE) to secure traffic with higher throughput than the default IPsec throughput. |
| Support for IPv6 | Enable IPv6 support on the Transit Gateway. This option appears if the VPC/VNet supports IPv6. |
| Attach to Transit Gateways | Select Transit Gateways for peering. Transit Gateway peering connects two or more Aviatrix Transit Gateways so Spoke VPCs and VNets can communicate through those Transit Gateways. |
| Advanced Settings | |
| Transit Egress Capability (all clouds except OCI and Alibaba Cloud) | Makes this Transit Gateway available for a Transit FireNet workflow or a Transit Egress workflow. For Transit Egress, the Controller adds subnets to the Transit VPC for Transit Egress use. |
| Gateway Load Balancer (AWS only) | For AWS, when Transit Egress Capability is on, optionally enable Gateway Load Balancer to create a load balancer in the selected VPC. If this option is On here, it appears disabled after you add Transit FireNet to the gateway in the Transit FireNet workflow. Use this when the Transit Gateway will run Transit FireNet with firewalls attached for inspection. |
| Subnet (GCP only) | For GCP, when Transit Egress Capability is on, select the subnet of a LAN VPC that exchanges traffic between the gateway and a firewall. |
| BGP over LAN (Azure) | Enable BGP over LAN and enter the number of LAN interfaces (maximum is eight). |
| BGP over LAN (GCP) | Enable BGP over LAN and select the subnet for the connection. For GCP, you cannot set BGP over LAN to On after the Transit Gateway is created. |
| Instances | |
| Attach to Subnet | Select the subnet where the Transit Gateway instance runs. |
| Public IP | Assign a public IP address to the Transit Gateway instance. |
| Resource Tags | |
| Resource Tags | Add key and value tags to identify the Transit Gateway. |
| Cloud Provider | Instance Sizes that Support HPE |
|---|---|
| AWS | c5, c5n, c6in |
| Azure | Standard, except B1ms, B2s, B4ms, B8ms, D1_v2, D2_v2, DS1_v2, DS2_v2, D2s_v3, D4s_v3, F2s_v2, F4s_v2 |
| GCP | n1-standard (except standard-1, standard-2), n1-highcpu (except highcpu-2) |
| OCI | All instance sizes Note: HPE is supported only on OCI Spoke/Transit Gateways. |
Edit a Transit Gateway
Edit a Transit Gateway
-
Go to Cloud Fabric > Gateways > Transit Gateways.
A table appears with the list of Transit Gateways. -
Locate the Transit Gateway to edit on the table and click the Edit icon
on the right side of its row.
The Edit Transit Gateway dialog appears. -
The editable parameters are as follows:
- Instance Size
- Support for IPv6 (AWS, Azure, and GCP on Controller 9.0+)
- Attach To Transit Gateways
- BGP over LAN (Azure only)
- Transit Egress Capability
Note: Changing BGP over LAN interfaces reboots the gateway and may cause traffic disruption.
- HA instances
Refer to the Parameter Details table for more details.
-
To add a HA Transit Gateway:
- In the Instances section, click + Instance. A new card appears.
- In the new card, select a subnet in a different availability zone (AZ) from the primary Transit Gateway.
- Enter the Public IP address of the HA Transit Gateway.
- To delete a HA Transit Gateway, in the Instances section, click the delete icon next to the HA Transit Gateway.
- Click Save.
Parameter Details
| CoPilot Parameter Name | Description |
|---|---|
| Instance Size | Change the gateway’s instance size. |
| Attach To Transit Gateways | Add or remove Transit Gateway peering. |
| BGP over LAN (Azure only) | Enable BGP over LAN and set number of interfaces (Azure only). |
| Transit Egress Capability | Enable transit egress capability on the Transit Gateway. |
| Subnet (GCP only) | Select the subnet when Transit Egress Capability is enabled. |
| BGP over LAN (Azure) | Enable BGP over LAN and enter the number of LAN interfaces. |
| BGP over LAN (GCP) | Enable BGP over LAN and select the subnet for it. |
| Attach to Subnet | Attach a subnet to the new HA instance. |
| Public IP (AWS only) | Select a public IP for the new HA instance. |
| Resource Tags | Add or remove key and value tags to identify the Transit Gateway. |
Delete a Transit Gateway
Delete a Transit Gateway
- Go to Cloud Fabric > Gateways > Transit Gateways.
A table appears with the list of Transit Gateways. - Locate the Transit Gateway to delete on the table and click the Delete
icon on the right side of its row.
The Delete Transit Gateway dialog appears. - Read and understand the warning message, and tick the checkbox to confirm the deletion.
- Click Delete.
Manage Gateway Attachments
Manage Gateway Attachments
Attach a Transit Gateway
Attach a Transit Gateway
- Go to Cloud Fabric > Gateways > Transit Gateways.
A table appears with the list of Transit Gateways. - Locate the Transit Gateway to attach on the table and click the Manage Gateway Attachments icon on the right side of its row.
The Manage Gateway Attachments dialog appears. - In the Manage Gateway Attachments dialog, click the Transit Gateway tab.
- Click + Attachment.
A Transit Gateway card appears. - In the Transit Gateway card, provide the information.
Refer to the Parameter Details table. - Click Save.
Parameter Details
| CoPilot Parameter Name | Description |
|---|---|
| Transit Gateway | Select the Transit Gateway to attach to the Transit Gateway. |
| Max Performance | Creates the maximum number of High Performance Encryption (HPE) tunnels for the Transit-to-Transit attachment when set to On. The number of tunnels that are created depends on the gateway instance sizes. Note: Max Performance option is valid only when both Transit Gateways are launched with HPE enabled and are in the same cloud type. If Max Performance is Off, only one tunnel is created (even when HPE is enabled for both the Spoke and Transit Gateway). |
| Attach Over | Connectivity over a private or public network, when both Transit Gateways are launched with HPE enabled and are in the different cloud types.
|
| Single-Tunnel Mode | Creates a single tunnel connection for the Transit-to-Transit attachment. When set to On, a single tunnel is created. When set to Off, multiple High Performance Encryption (HPE) tunnels are created based on the gateway instance size. Single-Tunnel Mode is supported for private network connectivity. |
| Jumbo Frame | Enables Jumbo Frames for throughput performance when set to On. Jumbo Frame is supported for private network connectivity. |
| High Performance Encryption | Creates High Performance Encryption (HPE) tunnels between the Transit Gateways when set to On. Note: High Performance Encryption is valid when both Transit Gateways are launched with HPE enabled and are in the different cloud types connected over a public network. In Number of Tunnels, specify the number of tunnels to create.
If High Performance Encryption is Off, only one tunnel is created (even when HPE is enabled for both Transit Gateways). To switch between multiple tunnels or one tunnel, detach and reattach the Gateways. |
| Exclude Network CIDRs | Excludes network CIDRs from being propagated to the other Transit Gateway when set to On. In Excluded Network CIDRs, enter the CIDRs to be excluded. |
| Exclude TGW Connections | Excludes TGW connections from being advertised when set to On. In Local Gateway Excluded TGW Connections, select the TGW connection(s) to exclude from being advertised to the remote gateway. In Remote Gateway Excluded TGW Connections, select the TGW connection(s) to exclude from being advertised to the Transit Gateway. |
| Availability Zone Affinity | Prefer gateways in the same Availability Zone to reduce cross-AZ data transfer costs and latency. Note:
|
| Outbound Filtered Routes | Enter one or more network CIDRs to exclude from the routes advertised outbound from the Transit Gateway attachment. Routes matching a listed CIDR are not advertised to the other Transit Gateway. This field is optional. |
Attach a Spoke Gateway
Attach a Spoke Gateway
- Go to Cloud Fabric > Gateways > Transit Gateways.
A table appears with the list of Transit Gateways. - Locate the Transit Gateway to attach on the table and click the Manage Gateway Attachments icon on the right side of its row.
The Manage Gateway Attachments dialog appears. - In the Manage Gateway Attachments dialog, click the Spoke Gateway tab.
- Click + Attachment.
A Spoke Gateway card appears. - In the Spoke Gateway card, provide the information.
Refer to the Parameter Details table. - Click Save.
Parameter Details
| CoPilot Parameter Name | Description |
|---|---|
| Spoke Gateway | Select the Spoke Gateway to attach to the Transit Gateway. |
| Select Route Table | Enables custom route tables when set to On. From the Select Route Tables dropdown menu, select the custom route table(s) to attach to this Spoke Gateway. |
| Max Performance | Creates the maximum number of High Performance Encryption (HPE) tunnels for the Transit-to-Spoke attachment when set to On. The number of tunnels that are created depends on the gateway instance sizes. Note:
If Max Performance is Off, only one tunnel is created (even when HPE is enabled for both the Spoke and Transit Gateway). To switch between multiple tunnels or one tunnel, detach and reattach the Gateways. |
| Availability Zone Affinity | Prefer gateways in the same Availability Zone to reduce cross-AZ data transfer costs and latency. Note:
|
| Outbound Filtered Routes | Enter one or more network CIDRs to exclude from the routes advertised outbound from the Spoke Gateway attachment. Routes matching a listed CIDR are not advertised from the Spoke Gateway. This field is optional. |
Attach an Azure VNet
Attach an Azure VNet
- Go to Cloud Fabric > Gateways > Transit Gateways.
A table appears with the list of Transit Gateways. - Locate the Transit Gateway to attach on the table and click the Manage Gateway Attachments icon on the right side of its row.
The Manage Gateway Attachments dialog appears. - In the Manage Gateway Attachments dialog, click the Azure VNet tab.
- Click + Attachment.
The Azure VNet card appears. - In the Azure VNet card, select the Azure Spoke VNet to attach to the Transit Gateway.
- Click Save.
Detach a Transit Gateway Attachment
Detach a Transit Gateway Attachment
- Go to Cloud Fabric > Gateways > Transit Gateways.
A table appears with the list of Transit Gateways. - Locate the Transit Gateway to detach on the table and click the Manage Gateway Attachments icon on the right side of its row.
The Manage Gateway Attachments dialog appears. - In the Manage Gateway Attachments dialog, click the Transit Gateway tab, Spoke Gateway tab, or the Azure VNet tab.
- Hover over the attachment to view the Delete icon on the right side of the attachment.
- Click the Delete icon.
- Click Save to detach the attachment.
Actions on Transit Gateway
Actions on Transit Gateway
Resize a Gateway
Resize a Gateway
Changing a Transit Gateway instance size may cause network traffic disruption. During AWS Spoke Gateway resizing, traffic loss may occur.
- Go to Cloud Fabric > Gateways > Transit Gateways.
A table appears with the list of Transit Gateways. - Locate the Gateway to resize on the table and click the Actions button (three dots) on the right side of its row.
- Click Resize Gateway.
The Resize Gateway Instance dialog appears. - Select Resize Now or Schedule Resize.
- Select a Target Gateway Instance Size from the dropdown menu.
- Select a Maintenance Window from the dropdown menu for scheduling the resize.
- Click Resize Now or Schedule Resize to resize the Gateway.
| Instance Size | Expected Throughput |
|---|---|
| AWS Performance | |
| T2 series | Not guaranteed; can burst up to 130 Mbps |
| c5.2xlarge | 2 to 2.5 Gbps |
| c5.4xlarge | 2 to 2.5 Gbps |
| c5n.4xlarge | 25 Gbps with HPE Mode |
| c5n.9xlarge | 70 Gbps with HPE Mode |
| c5n.18xlarge | 70 Gbps with HPE Mode |
| AWS Storage | EBS gp3 or gp2 volumes supported. To change volume, refer to AWS documentation. |
| Azure Performance (without HPE Mode) | |
| B series | Burstable, up to 260 Mbps |
| D / Ds series | 480 Mbps to 1.2 Gbps |
| F series | Approximately 450 Mbps to 1.2 Gbps. |
| GCP Performance (Without HPE) | |
| n1-standard-1 | 1.0 to 1.2 Gbps |
| n1-standard-2 | 1.0 to 1.2 Gbps |
| n1-highcpu-2 | 1.0 to 1.2 Gbps |
| n1-standard-4 | 2.3 to 2.5 Gbps |
| n1-highcpu-2 | 2.3 to 2.5 Gbps |
| OCI Performance | |
| VM.Standard2.2 or larger |
|
| OCI Flexible Shapes: E4 | |
| FLEX4.16 | 4 OCPU, 16 GB RAM |
| FLEX8.32 | 8 OCPU, 32 GB RAM |
| FLEX16.32 | 16 OCPU, 32 GB RAM |
| OCI Flexible Shapes: E5 | |
| FLEX4.16 | 4 OCPU, 16 GB RAM |
| FLEX8.32 | 8 OCPU, 32 GB RAM |
| FLEX16.32 | 16 OCPU, 32 GB RAM |
| OCI Flexible Shapes: E6 | |
| FLEX4.16 | 4 OCPU, 16 GB RAM |
| FLEX8.32 | 8 OCPU, 32 GB RAM |
| FLEX16.32 | 16 OCPU, 32 GB RAM |
Gateway-Specific Actions
Gateway-Specific Actions
View Transit Gateway Details
View Transit Gateway Details
- Go to Cloud Fabric > Gateways > Transit Gateways.
A table appears with the list of Transit Gateways. - Click the Gateway Name in the table.
The Transit Gateway Details page opens with tabs for Details, Instances, Attachments, VPC/VNet Route Tables, Gateway Routes, Interface Stats, Route DB, Performance, and Settings. - Click each tab to view the corresponding information.
Parameter Details
| CoPilot Parameter Name | Description |
|---|---|
| General Information | |
| Account Name | Displays the cloud account name that owns the Transit Gateway. |
| Gateway Name | Displays the current name of the Transit Gateway. |
| Gateway Original Name | Displays the original name assigned during gateway creation. |
| VPC ID | Displays the ID of the VPC or VNet where the Transit Gateway runs. |
| Region | Displays the cloud region where the Transit Gateway runs. |
| Primary CIDR | Displays the primary CIDR block associated with the Transit Gateway VPC or VNet. |
| CIDRs | Displays all CIDR blocks associated with the Transit Gateway VPC or VNet. |
| Type | Displays the gateway deployment type. |
| GW Instance Public IP | Displays the public IP address of the Transit Gateway instance. |
| GW Instance Private IP | Displays the private IP address of the Transit Gateway instance. |
| GW Instance Size | Displays the instance size of the Transit Gateway. |
| GW EBS encryption | Displays whether EBS encryption is enabled for the gateway volume. |
| Direct Internet | Displays the direct internet access status. |
| Designated gateway | Displays whether the gateway acts as a designated gateway. |
| Extended public CIDRs | Displays extended public CIDR ranges if configured. |
| Single AZ gateway HA | Displays whether single availability zone high availability is enabled. |
| Monitor Subnets | Displays whether subnet monitoring is enabled. |
| ActiveMesh mode | Displays whether ActiveMesh mode is enabled. |
| Private Channel | Displays whether private channel is enabled. |
| Private OOB | Displays whether private out-of-band management is enabled. |
| Stateful Firewall | Displays the stateful firewall status. |
| Private S3 | Displays whether private S3 access is enabled. |
| Egress Control | Displays whether egress control is enabled. |
| Public DNS Server | Displays the public DNS server configured for the gateway. |
| SNAT Enabled | Displays whether source NAT is enabled. |
| VPN Access | Displays whether VPN access is enabled. |
| IMDSv2 Enforcement | Displays whether IMDSv2 enforcement is enabled. |
| Transit Gateway | Displays whether the gateway functions as a Transit Gateway. |
| TGW Integration | Displays whether AWS TGW integration is enabled. |
| FireNet Function | Displays the FireNet function status. |
| Subnet Information | |
| Subnet Name/ID | Displays the subnet name or subnet ID associated with the Transit Gateway. |
| Availability Zone | Displays the availability zone of the subnet. |
| IP CIDR | Displays the IP CIDR block of the subnet. |
| Certs Info | |
| subject | Displays the subject information of the gateway certificate. |
| issuer | Displays the issuer information of the gateway certificate. |
| notBefore | Displays the certificate validity start time. |
| notAfter | Displays the certificate validity end time. |
View VPC/VNet Route Tables
View VPC/VNet Route Tables
- Go to Cloud Fabric > Gateways > Transit Gateways.
The Transit Gateways table appears. - Click the Transit Gateway name.
The Transit Gateway Details page appears. - Click the VPC/VNet Route Tables tab.
The VPC/VNet Route Tables page appears. - If more than one route table is listed, use the Route Table dropdown to select a table.
Parameter Details
| CoPilot Parameter Name | Description |
|---|---|
| Route Table | Dropdown used to choose which route table to display when multiple tables exist. |
| Route Table ID | Cloud route table identifier for the VPC or VNet. |
| Associated Subnets | Subnets associated with the route table; egress from VMs in those subnets follows this route table. |
| Route | Destination IP range (CIDR); traffic destined to this range matches this route. |
| Target | Identifier of the next-hop resource egress traffic is sent to. |
| Gateway | Name of the next-hop gateway or device egress traffic is sent to. |
| Status | Active: path to the next hop is up. Blackhole: path to the next hop is down; matching traffic is dropped. |
View Transit Gateway Routes
View Transit Gateway Routes
- Go to Cloud Fabric > Gateways > Transit Gateways.
The Transit Gateways table appears. - Click the Transit Gateway name.
The Transit Gateway Details page appears. - Click the Gateway Routes tab.
The Transit Gateway Routes page appears.
Parameter Details
| CoPilot Parameter Name | Description |
|---|---|
| Destination | Destination IP address range (CIDR). Traffic within this range follows this route entry. |
| Via | Default gateway IP of the subnet the Aviatrix gateway belongs to; meaningful for LAN interfaces such as Eth0. |
| Interface | Interface name used to egress traffic matching this route. |
| Next Hop IP | Remote device IP for a point-to-point tunnel interface. |
| Next Hop Gateway | Name of the remote device for a point-to-point tunnel interface. |
| Metric | Route priority; the higher the value, the lower the preference. |
| Weight | When multiple paths exist for the same destination, relative weight used for traffic distribution; for ECMP, weights are equal across tunnels. |
| Status | Route operational status (for example Up or Down). |
Configure SNAT on a Transit Gateway
Configure SNAT on a Transit Gateway
- Go to Cloud Fabric > Gateways > Transit Gateways.
A table appears with the list of Transit Gateways. - Click the Transit Gateway name.
The Transit Gateway Details page opens. - Click the Settings tab. Expand Network Address Translation (NAT).
- Turn Source NAT to On.
- In Instance, select the primary gateway or an HA instance to configure.
- Click + Rule. Enter rule fields.
Refer to the Parameter Details table for more details. - Click Save.
Parameter Details
| CoPilot Parameter Name | Description |
|---|---|
| Source CIDR | Source IP range for the rule. Leave blank if unused. |
| Source Port | Source port for the rule. Leave blank if unused. |
| Destination CIDR | Destination IP range. If blank, a default route 0.0.0.0/0 to the gateway can be programmed in the cloud route table. |
| Destination Port | Destination port. Leave blank if unused. |
| Protocol | Protocol for the destination port. Leave blank if unused. |
| Connection | Output connection for the rule. Leave blank if unused. |
| Mark | TCP session mark or tag. Leave blank if unused. |
| SNAT IPs | Translated source IP when conditions match. Supports a range (for example, 100.100.1.5–100.100.1.10). At least one of SNAT IPs or SNAT Port must be set for the rule to take effect, per the UI. |
| SNAT Port | Translated source port when conditions match. At least one of SNAT IPs or SNAT Port must be set for the rule to take effect, per the UI. |
| Apply Route Entry | When enabled, programs a cloud route so Destination CIDR points to the Transit Gateway. |
| Exclude Route Table | Private route tables to exclude from default route programming when combined with Apply Route Entry. |
Configure DNAT on a Transit Gateway
Configure DNAT on a Transit Gateway
- Go to Cloud Fabric > Gateways > Transit Gateways.
A table appears with the list of Transit Gateways. - Click the Transit Gateway name.
The Transit Gateway Details page opens. - Click the Settings tab. Expand Network Address Translation (NAT).
- Turn Destination NAT to On.
- In Instance, select the primary gateway or an HA instance to configure.
- Click + Rule. Enter rule fields.
Refer to the Parameter Details table for more details. - Click Save.
Parameter Details
| CoPilot Parameter Name | Description |
|---|---|
| Source CIDR | Source IP range for the rule. Leave blank if unused. |
| Source Port | Source port for the rule. Leave blank if unused. |
| Destination CIDR | Destination IP range before translation. If blank, default route 0.0.0.0/0 behavior can apply as in the UI. |
| Destination Port | Destination port. Leave blank if unused. |
| Protocol | Protocol for the destination port. Leave blank if unused. |
| Connection | Output connection for the rule. Leave blank if unused. |
| Mark | TCP session mark or tag. Leave blank if unused. |
| DNAT IPs | Translated destination IP when conditions match. Supports a range (for example, 100.101.2.5–100.101.2.10). At least one of DNAT IPs or DNAT Port must be set for the rule to take effect, per the UI. |
| DNAT Port | Translated destination port when conditions match. At least one of DNAT IPs or DNAT Port must be set for the rule to take effect, per the UI. |
| Apply Route Entry | When enabled, programs a cloud route so Destination CIDR points to the Transit Gateway. |
| Exclude Route Table | Private route tables to exclude from default route programming when combined with Apply Route Entry. |
Configure Manual BGP Advertised CIDR List
Configure Manual BGP Advertised CIDR List
- Go to Cloud Fabric > Gateways > Transit Gateways.
A table appears with the list of Transit Gateways. - Click the Transit Gateway name.
The Transit Gateway Details page opens. - Click the Settings tab. Expand Border Gateway Protocol (BGP).
- Scroll to Manual BGP Advertised CIDR List.
- For all BGP connections: enter CIDRs in Advertised CIDRs (Per Gateway).
- For one connection: select the connection in Connection, then enter CIDRs in Advertised CIDRs (Per Connection).
- Click Save.
Configure BGP AS Path Prepend
Configure BGP AS Path Prepend
- Go to Cloud Fabric > Gateways > Transit Gateways.
A table appears with the list of Transit Gateways. - Click the Transit Gateway name.
The Transit Gateway Details page opens. - Click the Settings tab. Expand Border Gateway Protocol (BGP).
- Scroll to AS Path Prepend.
- For all BGP connections: enter values in Prepend AS Path (Per Gateway).
- For one connection: select the connection in Connection, then enter values in Prepend AS Path (Per Connection).
- Click Save.
Configure Preserve AS Path (BGP)
Configure Preserve AS Path (BGP)
- On: AS Path is preserved; the gateway does not advertise manual BGP advertised CIDRs if those CIDRs are no longer in the best route DB.
- Off: AS Path is stripped on advertisements to neighbors.
- Go to Cloud Fabric > Gateways > Transit Gateways.
A table appears with the list of Transit Gateways. - Click the Transit Gateway name.
The Transit Gateway Details page opens. - Click the Settings tab. Expand Border Gateway Protocol (BGP).
- Set Preserve AS Path as needed.
- Click Save.
Configure BGP ECMP
Configure BGP ECMP
- Go to Cloud Fabric > Gateways > Transit Gateways.
A table appears with the list of Transit Gateways. - Click the Transit Gateway name.
The Transit Gateway Details page opens. - Click the Settings tab. Expand Border Gateway Protocol (BGP).
- Turn BGP ECMP On.
- Click Save.
Configure BGP Polling Time
Configure BGP Polling Time
- Go to Cloud Fabric > Gateways > Transit Gateways.
A table appears with the list of Transit Gateways. - Click the Transit Gateway name.
The Transit Gateway Details page opens. - Click the Settings tab. Expand Border Gateway Protocol (BGP).
- Set BGP Polling Time between 10 and 50 seconds.
- Click Save.
Configure BGP Hold Time
Configure BGP Hold Time
- Go to Cloud Fabric > Gateways > Transit Gateways.
A table appears with the list of Transit Gateways. - Click the Transit Gateway name.
The Transit Gateway Details page opens. - Click the Settings tab. Expand Border Gateway Protocol (BGP).
- Set BGP Hold Time between 12 and 180 seconds.
- Click Save.
Enable Site2Cloud RX Balancing (BGP)
Enable Site2Cloud RX Balancing (BGP)
- Go to Cloud Fabric > Gateways > Transit Gateways.
A table appears with the list of Transit Gateways. - Click the Transit Gateway name.
The Transit Gateway Details page opens. - Click the Settings tab. Expand Border Gateway Protocol (BGP).
- Turn Site2Cloud (S2C) RX Balancing On.
- Click Save.
Enable Gateway Learned CIDR Approval
Enable Gateway Learned CIDR Approval
- Go to Cloud Fabric > Gateways > Transit Gateways.
A table appears with the list of Transit Gateways. - Click the Transit Gateway name.
The Transit Gateway Details page opens. - Click the Settings tab. Expand Border Gateway Protocol (BGP).
- Turn Gateway Learned CIDR Approval On.
- Choose Gateway or Connection. For Connection, select the BGP connection in Connection.
- Click Save.
Customize Attached Spoke VPC/VNet Route Tables
Customize Attached Spoke VPC/VNet Route Tables
- Go to Cloud Fabric > Gateways > Transit Gateways.
A table appears with the list of Transit Gateways. - Locate the Transit Gateway to customize attached spoke VPC/VNet route tables on the table and click the Gateway name.
- Click the Settings tab and expand the Routing section.
- In the Customize Attached Spoke VPC/VNet Route CIDRs field, enter a
comma-separated list of IPv4 or IPv6 CIDR ranges.
- Specifying CIDRs disables automatic route propagation to attached Spoke VPC/VNet route tables.
- The specified CIDRs override routes propagated from other Spoke Gateways, Transit Gateways, and on-premises networks.
Exclude Learned CIDRs to Attached Spoke VPC/VNet Route Tables
Exclude Learned CIDRs to Attached Spoke VPC/VNet Route Tables
- Go to Cloud Fabric > Gateways > Transit Gateways.
A table appears with the list of Transit Gateways. - Locate the Transit Gateway to exclude learned CIDRs to attached spoke VPC/VNet route tables on the table and click the Gateway name.
- Click the Settings tab and expand the Routing section.
- In the Exclude Learned CIDRs to Attached Spoke VPC/VNet Route CIDRs field, enter a comma-separated list of IPv4 or IPv6 CIDR ranges.
- Click Save to exclude the learned CIDRs to attached spoke VPC/VNet route tables.
Exclude CIDRs from Attached Spokes Advertisement
Exclude CIDRs from Attached Spokes Advertisement
- Go to Cloud Fabric > Gateways > Transit Gateways.
A table appears with the list of Transit Gateways. - Locate the Transit Gateway to exclude CIDRs from attached spokes advertisement on the table and click the Gateway name.
- Click the Settings tab and expand the Routing section.
- In the CIDRs field, enter a comma-separated list of IPv4 or IPv6 CIDR ranges.
- Click Save to exclude the CIDRs from attached spokes advertisement.
Customize Transit VPC/VNet Routes
Customize Transit VPC/VNet Routes
- Go to Cloud Fabric > Gateways > Transit Gateways.
A table appears with the list of Transit Gateways. - Locate the Transit Gateway to customize transit VPC/VNet routes on the table and click the Gateway name.
- Click the Settings tab and expand the Routing section.
- In the Customize Transit VPC/VNet Routes CIDRs field, enter a comma-separated list of IPv4 or IPv6 CIDR ranges.
- Click Save to customize the transit VPC/VNet routes. A notification appears confirming the customization of the transit VPC/VNet routes.
Purpose
The Spoke Gateways page lets you view the list of configured Spoke Gateways and their details.A Spoke Gateway is a component of the Aviatrix Platform that you deploy on Spoke VPCs or VNets in a hub-and-spoke network topology. It enables connectivity between Spoke VPCs and VNets and other network endpoints, such as on-premises data centers, remote offices, or other cloud environments.Network traffic between Spoke VPCs and VNets and other endpoints flows through the Transit VPC or VNet.Elements
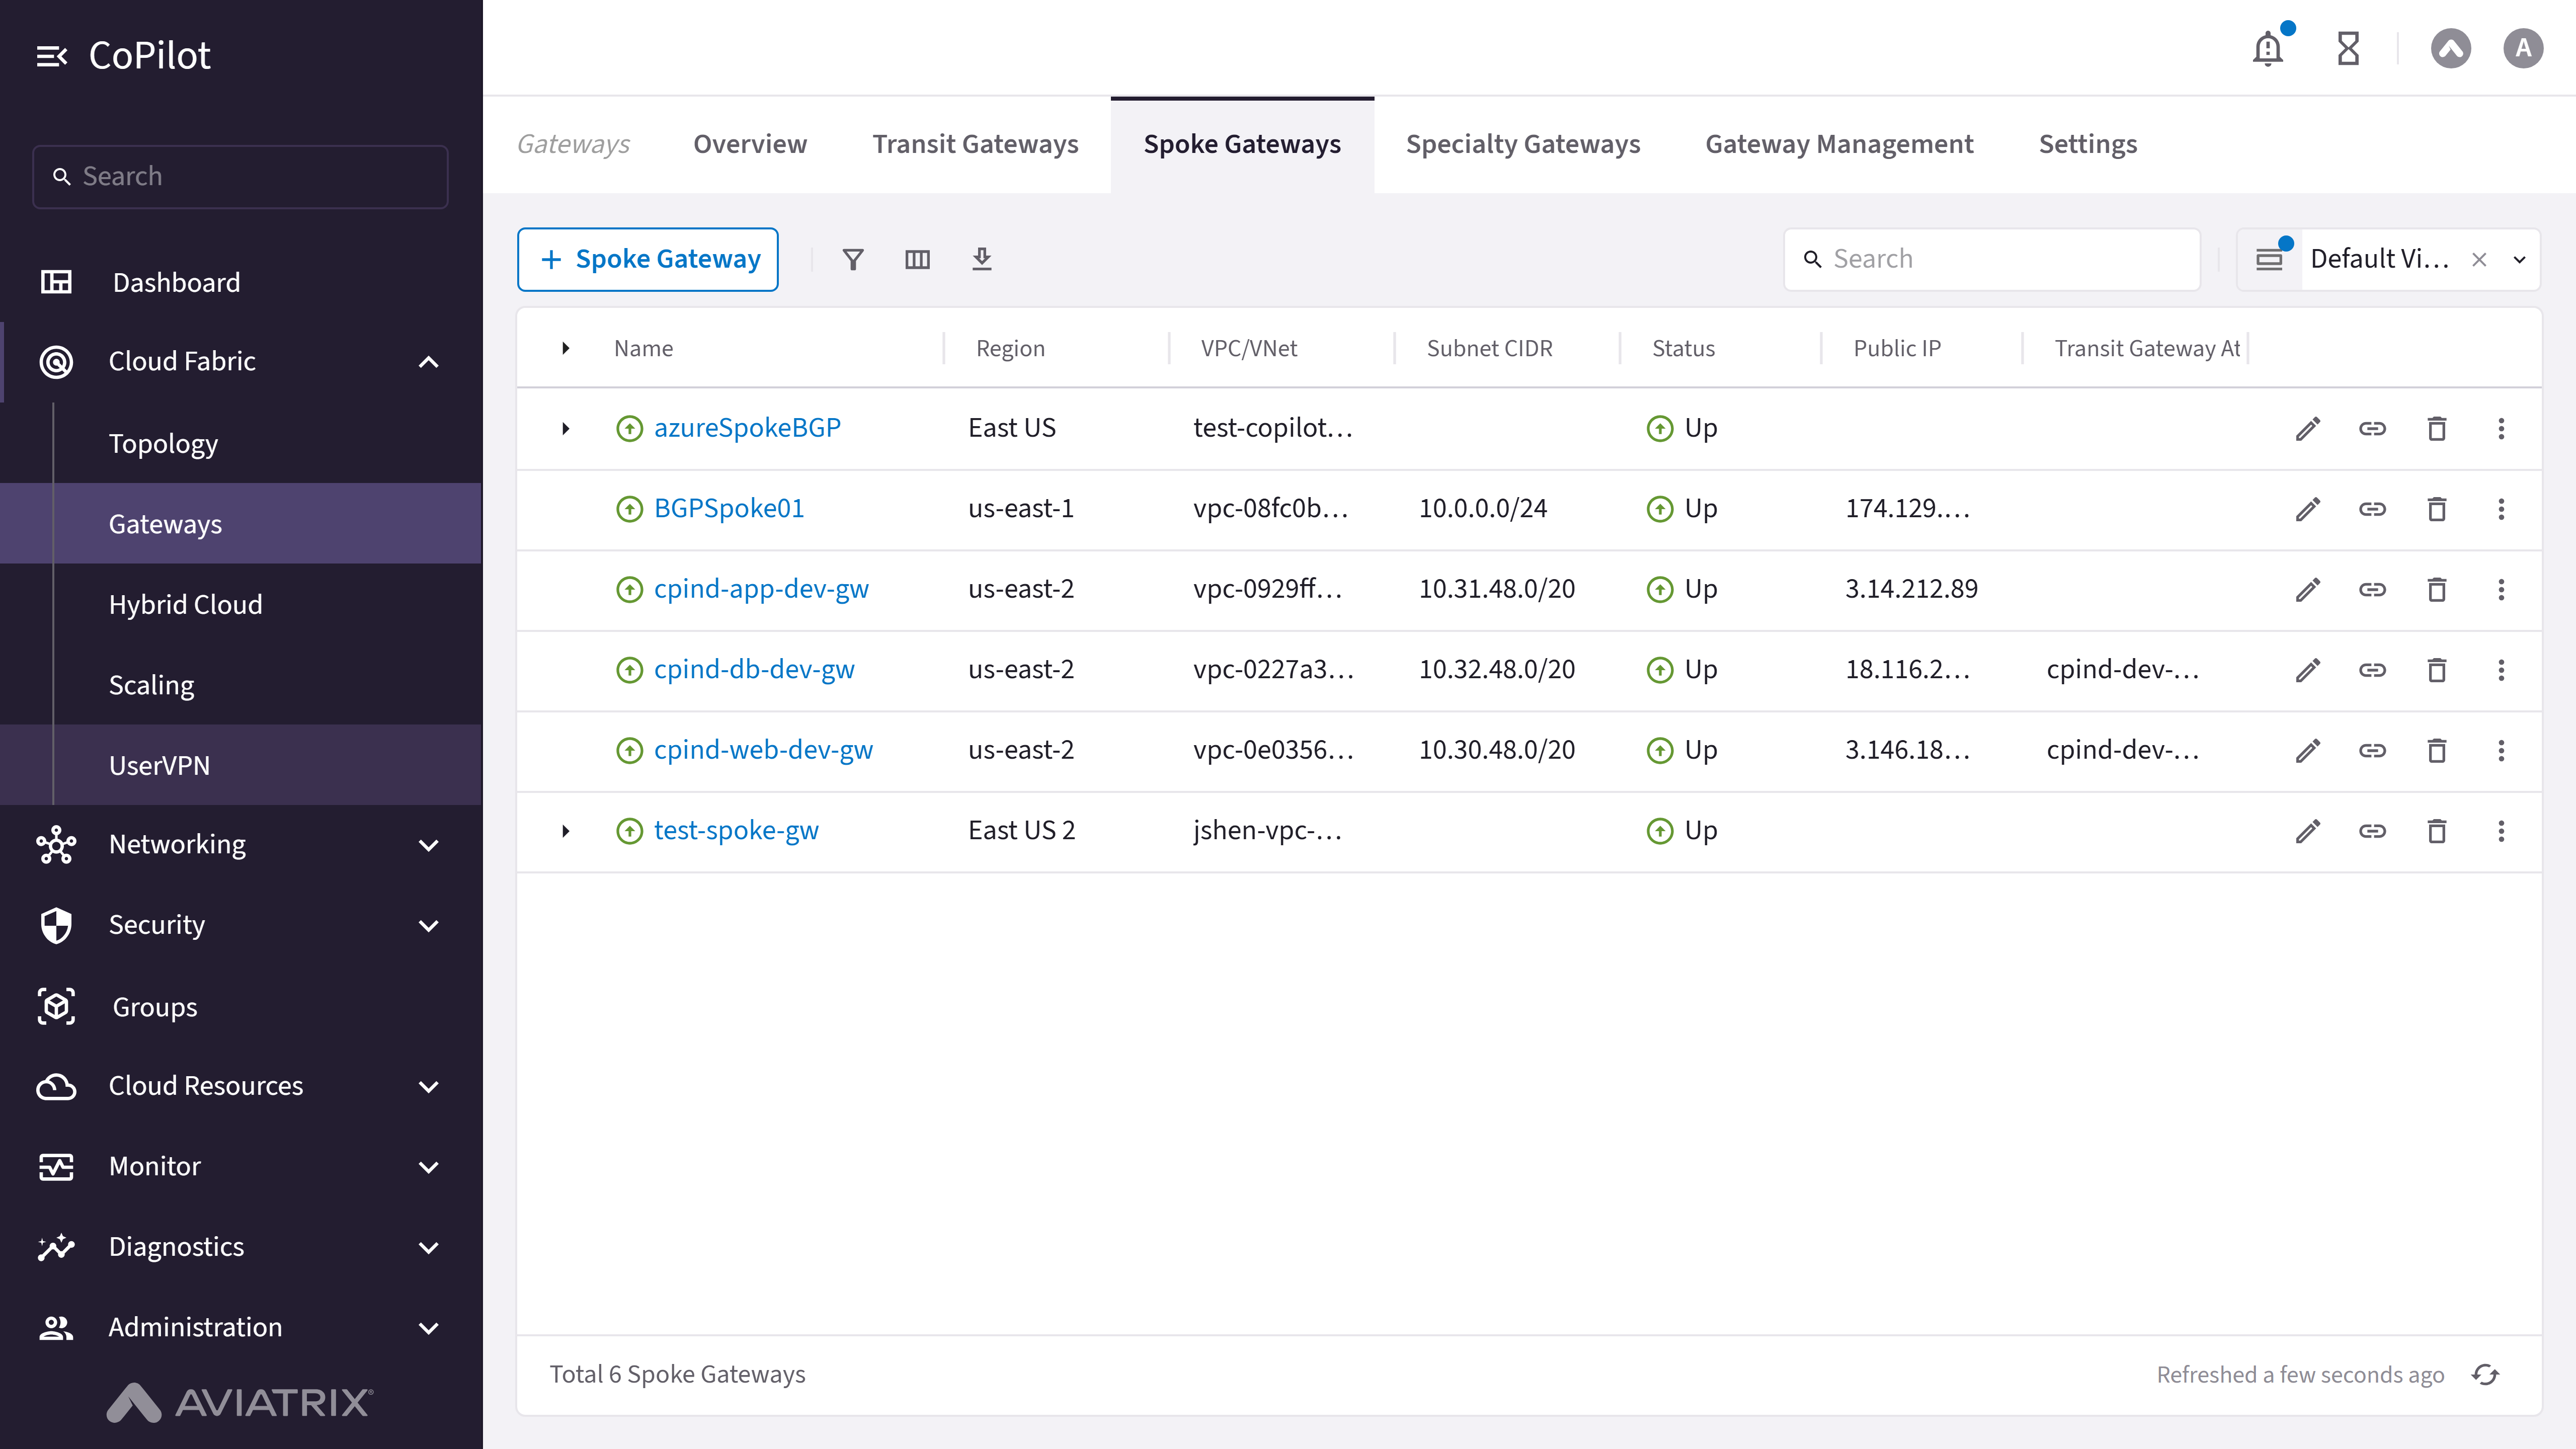
- + Spoke Gateway button: Initiates the workflow to create a new Spoke Gateway.
- Spoke Gateway table: Shows the details for each Spoke Gateway (cloud, account, region, VPC/VNet, status, attachments).
- Edit button: Edits the Spoke Gateway configuration (instance size, IPv6, Transit Gateway attachments, HA instances).
- Manage Gateway Attachments button: Adds or removes Transit Gateway, Egress Transit FireNet, and Spoke Gateway attachments.
- Delete button: Deletes the Spoke Gateway along with all of its instances and attachments.
- Actions button: Opens Gateway Diagnostics, Connectivity Diagnostics, and BGP Diagnostics.
- Gateway name link: Opens the Spoke Gateway Details page with tabs for Details, Instances, Attachments, VPC/VNet Route Tables, Gateway Routes, Interface Stats, Performance, and Settings.
Actions
Configure Spoke Gateway
Configure Spoke Gateway
View Spoke Gateways
View Spoke Gateways
- Go to Cloud Fabric > Gateways > Spoke Gateways.
The Spoke Gateways page appears with a table of Spoke Gateways and the + Spoke Gateway button. - Optionally, use the Search field or the Filter icon to find a Spoke Gateway.
- Optionally, click Edit on a row to edit the Spoke Gateway configuration.
- Optionally, click Manage Gateway Attachments on a row to add or remove Transit Gateway, Egress Transit FireNet, and Spoke Gateway attachments.
- Optionally, click Delete on a row to delete the Spoke Gateway along with all instances and attachments.
- Optionally, click Actions on a row to open Gateway Diagnostics, Connectivity Diagnostics, or BGP Diagnostics.
Parameter Details
| CoPilot Parameter Name | Description |
|---|---|
| Cloud | Shows the cloud provider where the Spoke Gateway runs, example: AWS, Azure, and GCP. |
| Account | Shows the cloud account under which the Spoke Gateway runs. |
| Region | Shows the cloud region where the Spoke Gateway runs. |
| VPC or VNet | Shows the Virtual Private Cloud or Virtual Network used by the Spoke Gateway. |
| VPC or VNet CIDR | Shows the CIDR block that defines the IP address range of the VPC or VNet. |
| Subnet ID | Shows the unique ID of the subnet used by the Spoke Gateway. |
| Subnet CIDR | Shows the CIDR block that defines the IP address range of the subnet. |
| Public IP | Shows the public IP address used by the Spoke Gateway for external traffic. |
| Private IP | Shows the private IP address used by the Spoke Gateway for internal traffic. |
| Instance size | Shows the compute size that runs the Spoke Gateway. |
| Status | Shows the current operational state of the Spoke Gateway, example: Up or Down. |
| Configuration status | Shows whether the Gateway configuration is Latest or Outdated. |
| High performance encryption | Shows whether high performance encryption is enabled for the Spoke Gateway. |
| FIPS Mode | Shows whether FIPS 140-3 compliant encryption mode is enabled for the Spoke Gateway (Controller 9.0 and later). |
| Transit Gateway Attachment | Shows the number of Transit Gateways attached to the Spoke Gateway. |
| Attachments | Shows the number of active attachments associated with the Spoke Gateway. |
Create a Spoke Gateway
Create a Spoke Gateway
- Go to Cloud Fabric > Gateways > Spoke Gateways.
A table appears with the list of Spoke Gateways. - Click + Spoke Gateway.
The Create Spoke Gateway dialog appears. - Configure the Spoke Gateway settings. Refer to the Parameter Details table below.
- In the Instances section, the primary instance is pre-configured. To add
HA instances, click + Instance.Note: A Spoke Gateway supports up to 15 gateway instances. All gateway instances operate in an active-active state and continue forwarding traffic if a tunnel fails between a Spoke VPC/VNet and Transit VPC/VNet. For best practice, deploy each HA gateway instance in separate public subnets across different availability zones when available.
- Click Save to create the Spoke Gateway.
Parameter Details
| CoPilot Parameter Name | Description |
|---|---|
| Name | Enter a unique name for the Spoke Gateway. Ensure that the name:
|
| Cloud | Select the cloud provider where the Spoke Gateway runs. |
| Account | Select the cloud account used to create the Spoke Gateway. |
| Region | Select the cloud region where the Spoke Gateway runs. |
| VPC/VNet | Select the VPC or VNet where the Spoke Gateway runs. |
| Instance Size | Select the compute size for the Spoke Gateway. Note: The instance size affects the IPsec performance of the Spoke Gateway. |
| High Performance Encryption | Enable or disable High Performance Encryption (HPE) to secure traffic with higher throughput than the default IPsec throughput. |
| Support for IPv6 | Enable or disable IPv6 support on the Spoke Gateway. Available when IPv6 is enabled on the Controller and supported for the selected VPC/VNet. |
| Attach to Egress Transit FireNet | Select the Egress Transit FireNet to attach to the Spoke Gateway. |
| Transparent Inspection via AWS TGW | (AWS only) Toggle to enable transparent inspection of VPC traffic through an AWS Transit Gateway without routing changes to the VPC. |
| Customize Inspection by Route Tables | When Transparent Inspection via AWS TGW is On, enable this checkbox to restrict inspection to specific route tables. Excludes route tables associated with the Aviatrix Gateway and Cloud Native Transit attachments. |
| Route Tables | When Customize Inspection by Route Tables is enabled, select the specific VPC route tables to include in inspection. |
| Attach to Transit Gateway | Select the Transit Gateway to attach to the Spoke Gateway. |
| Advanced Settings | |
| BGP | Enable or disable Border Gateway Protocol (BGP) for dynamic routing. When enabled, installs the required BGP package for external connections in ActiveMesh setups and terminates BGP sessions on this gateway. |
| BGP over LAN | (Azure only) Enable or disable BGP route exchange over local networks without IPsec. Use when planning to connect external BGP peers via LAN. Requires BGP to be enabled. |
| Number of Interfaces | When BGP over LAN is enabled, specify the number of gateway LAN interfaces to add for BGP route exchange. |
| Load Balance | (AWS only) Enable or disable load balancing for the Spoke Gateway. Available when the AWS Gateway Load Balancer feature is enabled on the Controller. |
| Symmetric Routing | (AWS only) Ensures return traffic uses the same spoke gateway path as the forward traffic. Required for stateful services such as firewalls, NAT, and traffic inspection. |
| Global VPC | (GCP only) Enable or disable connection to a global VPC. |
| Instances | |
| Attach to Subnet | Select the subnet where each Spoke Gateway instance runs. For HPE-enabled gateways, select an unused /26 subnet CIDR. |
| Public IP | Assign a public IP address to each Spoke Gateway instance. |
| Resource Tags | (AWS and Azure only) |
| Resource tags | Add key-value pairs to identify and organize Spoke Gateway resources in your cloud provider. |
Edit a Spoke Gateway
Edit a Spoke Gateway
- Go to Cloud Fabric > Gateways > Spoke Gateways.
A table appears with the list of Spoke Gateways. - Locate the Spoke Gateway to edit on the table and click the Edit icon on
the right side of its row.
The Edit Spoke Gateway dialog appears. - Edit the Spoke Gateway. Refer to the Parameter Details table for more details.
- To change the Instance Size, from the Instance Size dropdown menu, select a new size.
- (AWS, Azure, and GCP) To enable or disable IPv6 support, toggle the Support for IPv6 slider to On or Off.
- To attach a Transit Gateway, from Attach To Transit Gateway dropdown, select a Transit Gateway to attach the Spoke Gateway.
- To delete a Transit Gateway attachment, in Attach To Transit Gateway, click the delete icon next to the Transit Gateway attachment.
- To add a HA Spoke Gateway:
- In the Instances section, click + Instance. A new card appears.
- In the new card, select a subnet in a different availability zone (AZ) from the primary Spoke Gateway.
- Enter the Public IP address of the HA Spoke Gateway.
- To delete a HA Spoke Gateway, in the Instances section, click the delete icon next to the HA Spoke Gateway.
- Click Save to save the changes made to the Spoke Gateway.
Parameter Details
| CoPilot Parameter Name | Description |
|---|---|
| Instance Size | Change the compute size of the Spoke Gateway. For details, refer to the Instance Size Details section. |
| Transit Gateway Attachment | Change or update the attached Transit Gateway. |
| Customize Route Table | Enable or disable route table customization. |
| BGP | Enable or disable Border Gateway Protocol. |
| BGP over LAN (Azure only) | Enable BGP over LAN and set the number of LAN interfaces. |
| Symmetric Routing (AWS only) | Ensures return traffic uses the same spoke gateway path as the forward traffic. Required for stateful services such as firewalls, NAT, and traffic inspection. |
| Global VPC (GCP) | Enable or disable connection to a global VPC. |
| +Instance | Add a highly available gateway instance. |
| Attach to Subnet | Attach a subnet to the new instance. |
| Public IP | Select a public IP for a new HA instance (cloud-specific). |
| Resource Tags | Add or remove key and value tags to identify the Spoke Gateway. |
Delete a Spoke Gateway
Delete a Spoke Gateway
- Go to Cloud Fabric > Gateways > Spoke Gateways.
A table appears with the list of Spoke Gateways. - Locate the Spoke Gateway to delete on the table and click the Delete icon
on the right side of its row.
The Delete Spoke Gateway dialog appears. - Read and understand the warning message, and tick the checkbox to confirm the deletion.
- Click Delete to delete the Spoke Gateway.
Manage Gateway Attachments
Manage Gateway Attachments
Attach a Transit Gateway
Attach a Transit Gateway
- Go to Cloud Fabric > Gateways > Spoke Gateways.
A table appears with the list of Spoke Gateways. - Locate the Spoke Gateway to attach on the table and click the Manage
Gateway Attachment icon on the right side of its row.
The Manage Gateway Attachment dialog appears. - In the Manage Gateway Attachments dialog, click the Transit Gateway tab and then click + Attachment. The Transit Gateway card appears.
- In the Transit Gateway card, provide the information in the following Parameter Details section.
- Click Save to create the attachment.
Parameter Details
| CoPilot Parameter Name | Description |
|---|---|
| Transit Gateway | Select the Transit Gateway to attach to the Spoke Gateway. |
| Advanced | |
| Customize Route Table Attachment | Enable or disable route table customization. |
| Select Route Tables | Select the custom route tables after enabling the Customize Route Table Attachment. |
| Max Performance | Creates the maximum number of High Performance Encryption (HPE) tunnels for the Transit-to-Spoke attachment when set to On. The number of tunnels that are created depends on the gateway instance sizes. Note:
To switch between multiple tunnels or one tunnel, detach and reattach the Spoke Gateway to the Transit Gateway. |
| Availability Zone Affinity | Prefer gateways in the same Availability Zone to reduce cross-AZ data transfer costs and latency. Note:
|
| Outbound Filtered Routes | Enter one or more network CIDRs to exclude from the routes advertised outbound on this Transit Gateway attachment. Routes matching a listed CIDR are not advertised to the Transit Gateway. This field is optional. |
Attach an Egress Transit FireNet
Attach an Egress Transit FireNet
- Go to Cloud Fabric > Gateways > Spoke Gateways.
A table appears with the list of Spoke Gateways. - Locate the Spoke Gateway to attach on the table and click the Manage
Transit Gateway Attachment icon on the right side of its row.
The Manage Transit Gateway Attachment dialog appears. - In the Manage Transit Gateway Attachment dialog, click the Egress Transit FireNet tab and then click + Transit Gateway Attachment. The Egress Transit FireNet card appears.
- In the Egress Transit FireNet card, provide the information in the following Parameter Details section.
- Click Save to create the attachment.
Parameter Details
| CoPilot Parameter Name | Description |
|---|---|
| Transit Gateway | Select the Transit Gateway to attach to the Spoke Gateway. |
| Advanced | |
| Customize Route Table Attachment | Enable or disable route table customization. |
| Select Route Tables | Select the custom route tables after enabling the Customize Route Table Attachment. |
| Max Performance | Creates the maximum number of High Performance Encryption (HPE) tunnels for the Transit-to-Spoke attachment when set to On. The number of tunnels that are created depends on the gateway instance sizes. Note:
To switch between multiple tunnels or one tunnel, detach and reattach the Spoke Gateway to the Transit Gateway. |
Attach a Spoke Gateway
Attach a Spoke Gateway
- Go to Cloud Fabric > Gateways > Spoke Gateways.
A table appears with the list of Spoke Gateways. - Locate the Spoke Gateway to attach on the table and click the Manage
Gateway Attachment icon on the right side of its row.
The Manage Gateway Attachment dialog appears. - In the Manage Gateway Attachment dialog, click the Spoke Gateway tab.
- Click + Spoke Gateway Attachment. The Spoke Gateway dropdown menu appears.
- Select a Spoke Gateway from the Spoke Gateway dropdown menu.
- Click Save to create the attachment.
Detach a Spoke Gateway Attachment
Detach a Spoke Gateway Attachment
- Go to Cloud Fabric > Gateways > Spoke Gateways.
A table appears with the list of Spoke Gateways. - Locate the Spoke Gateway to detach the attachment on the table and click the
Manage Gateway Attachment icon on the right side of its row.
The Manage Gateway Attachment dialog appears. - In the Manage Gateway Attachment dialog, click the Spoke Gateway tab, Transit Gateway tab, or Egress Transit FireNet tab.
- Hover over the attachment to view the Delete icon on the right side of the attachment.
- Click the Delete icon.
- Click Save to detach the Spoke Gateway attachment.
Actions on Spoke Gateway
Actions on Spoke Gateway
Resize a Gateway
Resize a Gateway
Changing a Transit Gateway instance size may cause network traffic disruption. During AWS Spoke Gateway resizing, traffic loss may occur.
- Go to Cloud Fabric > Gateways > Spoke Gateways.
A table appears with the list of Spoke Gateways. - Locate the Gateway to resize on the table and click the Actions button (three dots) on the right side of its row.
- Click Resize Gateway.
The Resize Gateway Instance dialog appears. - Select Resize Now or Schedule Resize.
- Select a Target Gateway Instance Size from the dropdown menu.
- Select a Maintenance Window from the dropdown menu for scheduling the resize.
- Click Resize Now or Schedule Resize to resize the Gateway.
Gateway-Specific Actions
Gateway-Specific Actions
View Spoke Gateway Details
View Spoke Gateway Details
- Go to Cloud Fabric > Gateways > Spoke Gateways.
A table appears with the list of Spoke Gateways. - Click the Gateway name in the table.
The Spoke Gateway Details page opens with tabs for Details, Instances, Attachments, VPC/VNet Route Tables, Gateway Routes, Interface Stats, Performance, and Settings. - Click each tab to view the corresponding information.
Parameter Details (Details Tab)
| CoPilot Parameter Name | Description |
|---|---|
| Gateway Name | Displays the current name of the Spoke Gateway. |
| Account Name | Displays the cloud account that owns the Spoke Gateway. |
| Cloud | Displays the cloud provider where the Spoke Gateway runs. |
| Region | Displays the cloud region where the Spoke Gateway runs. |
| VPC/VNet | Displays the VPC or VNet associated with the Spoke Gateway. |
| Primary CIDR | Displays the primary CIDR block of the Spoke Gateway VPC/VNet. |
| Instance Size | Displays the instance size of the Spoke Gateway. |
| High Performance Encryption | Displays whether high performance encryption is enabled. |
| BGP | Displays whether BGP is enabled on the Spoke Gateway. |
| BGP over LAN | Displays whether BGP over LAN is enabled, if supported. |
Parameter Details (Instances Tab)
| CoPilot Parameter Name | Description |
|---|---|
| Name | Displays the name of the gateway instance. |
| Availability Zone | Displays the availability zone where the instance runs. |
| Subnet ID | Displays the subnet ID where the instance runs. |
| Status | Displays the operational status of the instance. |
| Public IP | Displays the public IP address assigned to the instance. |
| Private IP | Displays the private IP address assigned to the instance. |
Parameter Details (VPC/VNet Route Tables Tab)
| CoPilot Parameter Name | Description |
|---|---|
| Route Table ID | Identifier for the route table. |
| Destination CIDR | CIDR block for the route. |
| Target | Next hop for the route. |
Parameter Details (Gateway Routes Tab)
| CoPilot Parameter Name | Description |
|---|---|
| Route Type | Indicates whether the route is learned or static. |
| Destination CIDR | CIDR block for the route. |
| Next Hop | Gateway or interface used for forwarding traffic. |
Parameter Details (Performance Tab)
| CoPilot Parameter Name | Description |
|---|---|
| CPU Usage | Percentage of CPU used. |
| Memory Usage | Percentage of memory used. |
| Bandwidth | Network throughput in Mbps or Gbps. |
Configure SNAT on a Spoke Gateway
Configure SNAT on a Spoke Gateway
- Go to Cloud Fabric > Gateways > Spoke Gateways.
A table appears with the list of Spoke Gateways. - Click the Spoke Gateway name.
The Spoke Gateway Details page opens. - Click the Settings tab. Expand Network Address Translation (NAT).
- Turn Source NAT to On.
- Choose Single IP (default: Spoke Gateway primary IP as the SNAT address) or Customized SNAT (rules-based translation).
- In Instance, select the primary gateway or an HA instance to configure.
- For Customized SNAT, click + Rule, enter fields from the Parameter Details.
- Click Save.
Parameter Details
| CoPilot Parameter Name | Description |
|---|---|
| Source CIDR | Source IP range for the rule. Leave blank if unused. |
| Source Port | Source port for the rule. Leave blank if unused. |
| Destination CIDR | Destination IP range. If blank, a default route 0.0.0.0/0 to the gateway can be programmed in the cloud route table. |
| Destination Port | Destination port. Leave blank if unused. |
| Protocol | Protocol for the destination port. Leave blank if unused. |
| Connection | Output connection for the rule. Leave blank if unused. |
| Mark | TCP session mark or tag. Leave blank if unused. |
| SNAT IPs | Translated source IP when conditions match. Supports a range (for example, 100.100.1.5–100.100.1.10). At least one of SNAT IPs or SNAT Port must be set for the rule to take effect, per the UI. |
| SNAT Port | Translated source port when conditions match. At least one of SNAT IPs or SNAT Port must be set for the rule to take effect, per the UI. |
| Apply Route Entry | When enabled, programs a cloud route so Destination CIDR points to the Aviatrix Gateway. |
| Exclude Route Table | Private route tables to exclude from default route programming when combined with Apply Route Entry. |
Configure DNAT on a Spoke Gateway
Configure DNAT on a Spoke Gateway
- Go to Cloud Fabric > Gateways > Spoke Gateways.
A table appears with the list of Spoke Gateways. - Click the Spoke Gateway name.
The Spoke Gateway Details page opens. - Click the Settings tab. Expand Network Address Translation (NAT).
- Turn Destination NAT to On.
- In Instance, select the primary gateway or an HA instance to configure.
- Click + Rule. Enter fields from the Parameter Details table.
- Click Save.
Parameter Details
| CoPilot Parameter Name | Description |
|---|---|
| Source CIDR | Source IP range for the rule. Leave blank if unused. |
| Source Port | Source port for the rule. Leave blank if unused. |
| Destination CIDR | Destination IP range before translation. If blank, default route 0.0.0.0/0 behavior can apply as in the UI. |
| Destination Port | Destination port. Leave blank if unused. |
| Protocol | Protocol for the destination port. Leave blank if unused. |
| Connection | Output connection for the rule. Leave blank if unused. |
| Mark | TCP session mark or tag. Leave blank if unused. |
| DNAT IPs | Translated destination IP when conditions match. Supports a range (for example, 100.101.2.5–100.101.2.10). At least one of DNAT IPs or DNAT Port must be set for the rule to take effect, per the UI. |
| DNAT Port | Translated destination port when conditions match. At least one of DNAT IPs or DNAT Port must be set for the rule to take effect, per the UI. |
| Apply Route Entry | When enabled, programs a cloud route so Destination CIDR points to the Aviatrix Gateway. |
| Exclude Route Table | Private route tables to exclude from default route programming when combined with Apply Route Entry. |
Configure Manual BGP Advertised CIDR List
Configure Manual BGP Advertised CIDR List
- Go to Cloud Fabric > Gateways > Spoke Gateways.
A table appears with the list of Spoke Gateways. - Click the Spoke Gateway name.
The Spoke Gateway Details page opens. - Click the Settings tab. Expand Border Gateway Protocol (BGP).
- Scroll to Manual BGP Advertised CIDR List.
- For all BGP connections: enter CIDRs in Advertised CIDRs (Per Gateway).
- For one connection: select the connection in Connection, then enter CIDRs in Advertised CIDRs (Per Connection).
- Click Save.
Configure BGP AS Path Prepend
Configure BGP AS Path Prepend
- Go to Cloud Fabric > Gateways > Spoke Gateways.
A table appears with the list of Spoke Gateways. - Click the Spoke Gateway name.
The Spoke Gateway Details page opens. - Click the Settings tab. Expand Border Gateway Protocol (BGP).
- Scroll to AS Path Prepend.
- For all BGP connections: enter values in Prepend AS Path (Per Gateway).
- For one connection: select the connection in Connection, then enter values in Prepend AS Path (Per Connection).
- Click Save.
Configure Preserve AS Path (BGP)
Configure Preserve AS Path (BGP)
- On: AS Path is preserved; the gateway does not advertise manual BGP advertised CIDRs if those CIDRs are no longer in the best route DB.
- Off: AS Path is stripped on advertisements to neighbors.
- Go to Cloud Fabric > Gateways > Spoke Gateways.
A table appears with the list of Spoke Gateways. - Click the Spoke Gateway name.
The Spoke Gateway Details page opens. - Click the Settings tab. Expand Border Gateway Protocol (BGP).
- Set Preserve AS Path as needed.
- Click Save.
Configure BGP ECMP
Configure BGP ECMP
- Go to Cloud Fabric > Gateways > Spoke Gateways.
A table appears with the list of Spoke Gateways. - Click the Spoke Gateway name.
The Spoke Gateway Details page opens. - Click the Settings tab. Expand Border Gateway Protocol (BGP).
- Turn BGP ECMP On.
- Click Save.
Configure BGP Polling Time
Configure BGP Polling Time
- Go to Cloud Fabric > Gateways > Spoke Gateways.
A table appears with the list of Spoke Gateways. - Click the Spoke Gateway name.
The Spoke Gateway Details page opens. - Click the Settings tab. Expand Border Gateway Protocol (BGP).
- Set BGP Polling Time between 10 and 50 seconds.
- Click Save.
Configure BGP Hold Time
Configure BGP Hold Time
- Go to Cloud Fabric > Gateways > Spoke Gateways.
A table appears with the list of Spoke Gateways. - Click the Spoke Gateway name.
The Spoke Gateway Details page opens. - Click the Settings tab. Expand Border Gateway Protocol (BGP).
- Set BGP Hold Time between 12 and 180 seconds.
- Click Save.
Enable Gateway Learned CIDR Approval
Enable Gateway Learned CIDR Approval
- Go to Cloud Fabric > Gateways > Spoke Gateways.
A table appears with the list of Spoke Gateways. - Click the Spoke Gateway name.
The Spoke Gateway Details page opens. - Click the Settings tab. Expand Border Gateway Protocol (BGP).
- Turn Gateway Learned CIDR Approval On.
- Click Save.
Onboard All Route Tables
Onboard All Route Tables
- Go to Cloud Fabric > Gateways > Spoke Gateways.
A table appears with the list of Spoke Gateways. - Click the Spoke Gateway name.
The Spoke Gateway Details page opens. - Click VPC/VNet Route Tables tab.
- From the Route Table dropdown, click Onboard All Route Tables.
- Read and understand the warning message and click Onboard to confirm the onboarding.
Configure Private VPC/VNet Default Route
Configure Private VPC/VNet Default Route
- Go to Cloud Fabric > Gateways > Spoke Gateways.
A table appears with the list of Spoke Gateways. - Click the Spoke Gateway name.
The Spoke Gateway Details page opens. - Click the Settings tab and expand the Routing section.
- Enable Configure Private VPC/VNet Default Route as needed.
- Click Save to apply the change.
Skip Public VPC/VNet Route Table
Skip Public VPC/VNet Route Table
- Go to Cloud Fabric > Gateways > Spoke Gateways.
A table appears with the list of Spoke Gateways. - Click the Spoke Gateway name.
The Spoke Gateway Details page opens. - Click the Settings tab and expand the Routing section.
- Enable Skip Public VPC/VNet Route Table as needed.
- Click Save to apply the change.
Enable Auto Advertise Spoke Site2Cloud CIDRs
Enable Auto Advertise Spoke Site2Cloud CIDRs
- Go to Cloud Fabric > Gateways > Spoke Gateways.
A table appears with the list of Spoke Gateways. - Click the Spoke Gateway name.
The Spoke Gateway Details page opens. - Click the Settings tab and expand the Routing section.
- Enable Auto Advertise Spoke Site2Cloud CIDRs as needed.
- Click Save to apply the change.
Customize Spoke VPC/VNet Route Table
Customize Spoke VPC/VNet Route Table
- Go to Cloud Fabric > Gateways > Spoke Gateways.
A table appears with the list of Spoke Gateways. - Click the Spoke Gateway name.
The Spoke Gateway Details page opens. - Click the Settings tab and expand the Routing section.
- In Customize Spoke VPC/VNet Route Table (or CIDRs), enter a comma-separated list of IPv4 or IPv6 CIDRs. Only the specified CIDRs are programmed to the Spoke VPC/VNet route table.
- Click Save to apply the change. To disable the policy, leave the CIDRs field empty and save.
Exclude Learned CIDRs to Spoke VPC/VNet Route Table
Exclude Learned CIDRs to Spoke VPC/VNet Route Table
- Go to Cloud Fabric > Gateways > Spoke Gateways.
A table appears with the list of Spoke Gateways. - Click the Spoke Gateway name.
The Spoke Gateway Details page opens. - Click the Settings tab and expand the Routing section.
- In Exclude Learned CIDRs to Spoke VPC/VNet Route Table, enter a comma-separated list of IPv4 or IPv6 CIDRs to filter out from the route table.
- Click Save to apply the change.
Customize Spoke Advertised VPC/VNet CIDRs
Customize Spoke Advertised VPC/VNet CIDRs
- Go to Cloud Fabric > Gateways > Spoke Gateways.
A table appears with the list of Spoke Gateways. - Click the Spoke Gateway name.
The Spoke Gateway Details page opens. - Click the Settings tab and expand the Routing section.
- In Customize Spoke Advertised VPC/VNet CIDRs, enter or select the IPv4 or IPv6 CIDRs to advertise to on-premises (include list).
- Click Save to apply the change.
Update Encrypted Spoke VPC/VNet CIDRs
Update Encrypted Spoke VPC/VNet CIDRs
- Go to Cloud Fabric > Gateways > Spoke Gateways.
A table appears with the list of Spoke Gateways. - Click the Spoke Gateway name.
The Spoke Gateway Details page opens. - Click the Settings tab and expand the Routing section.
- Use Update Encrypted Spoke VPC/VNet CIDRs (or the equivalent action) to query the cloud and update the Spoke VPC/VNet route tables with any added CIDRs.
- Click Save if required to apply the update.
Purpose
The Specialty Gateways page lets you view the list of configured Specialty Gateways and their details.A Specialty Gateway is an Aviatrix Gateway designed for use cases that fall outside the roles of standard Spoke or Transit Gateways. These include Public Subnet Filtering (PSF) Gateways, which provide ingress and egress security for AWS public subnets where instances have public IP addresses. They also include VPN Gateways and FQDN Gateways used for domain-based egress filtering, often in conjunction with Transit FireNet or Transit Egress workflows.Elements
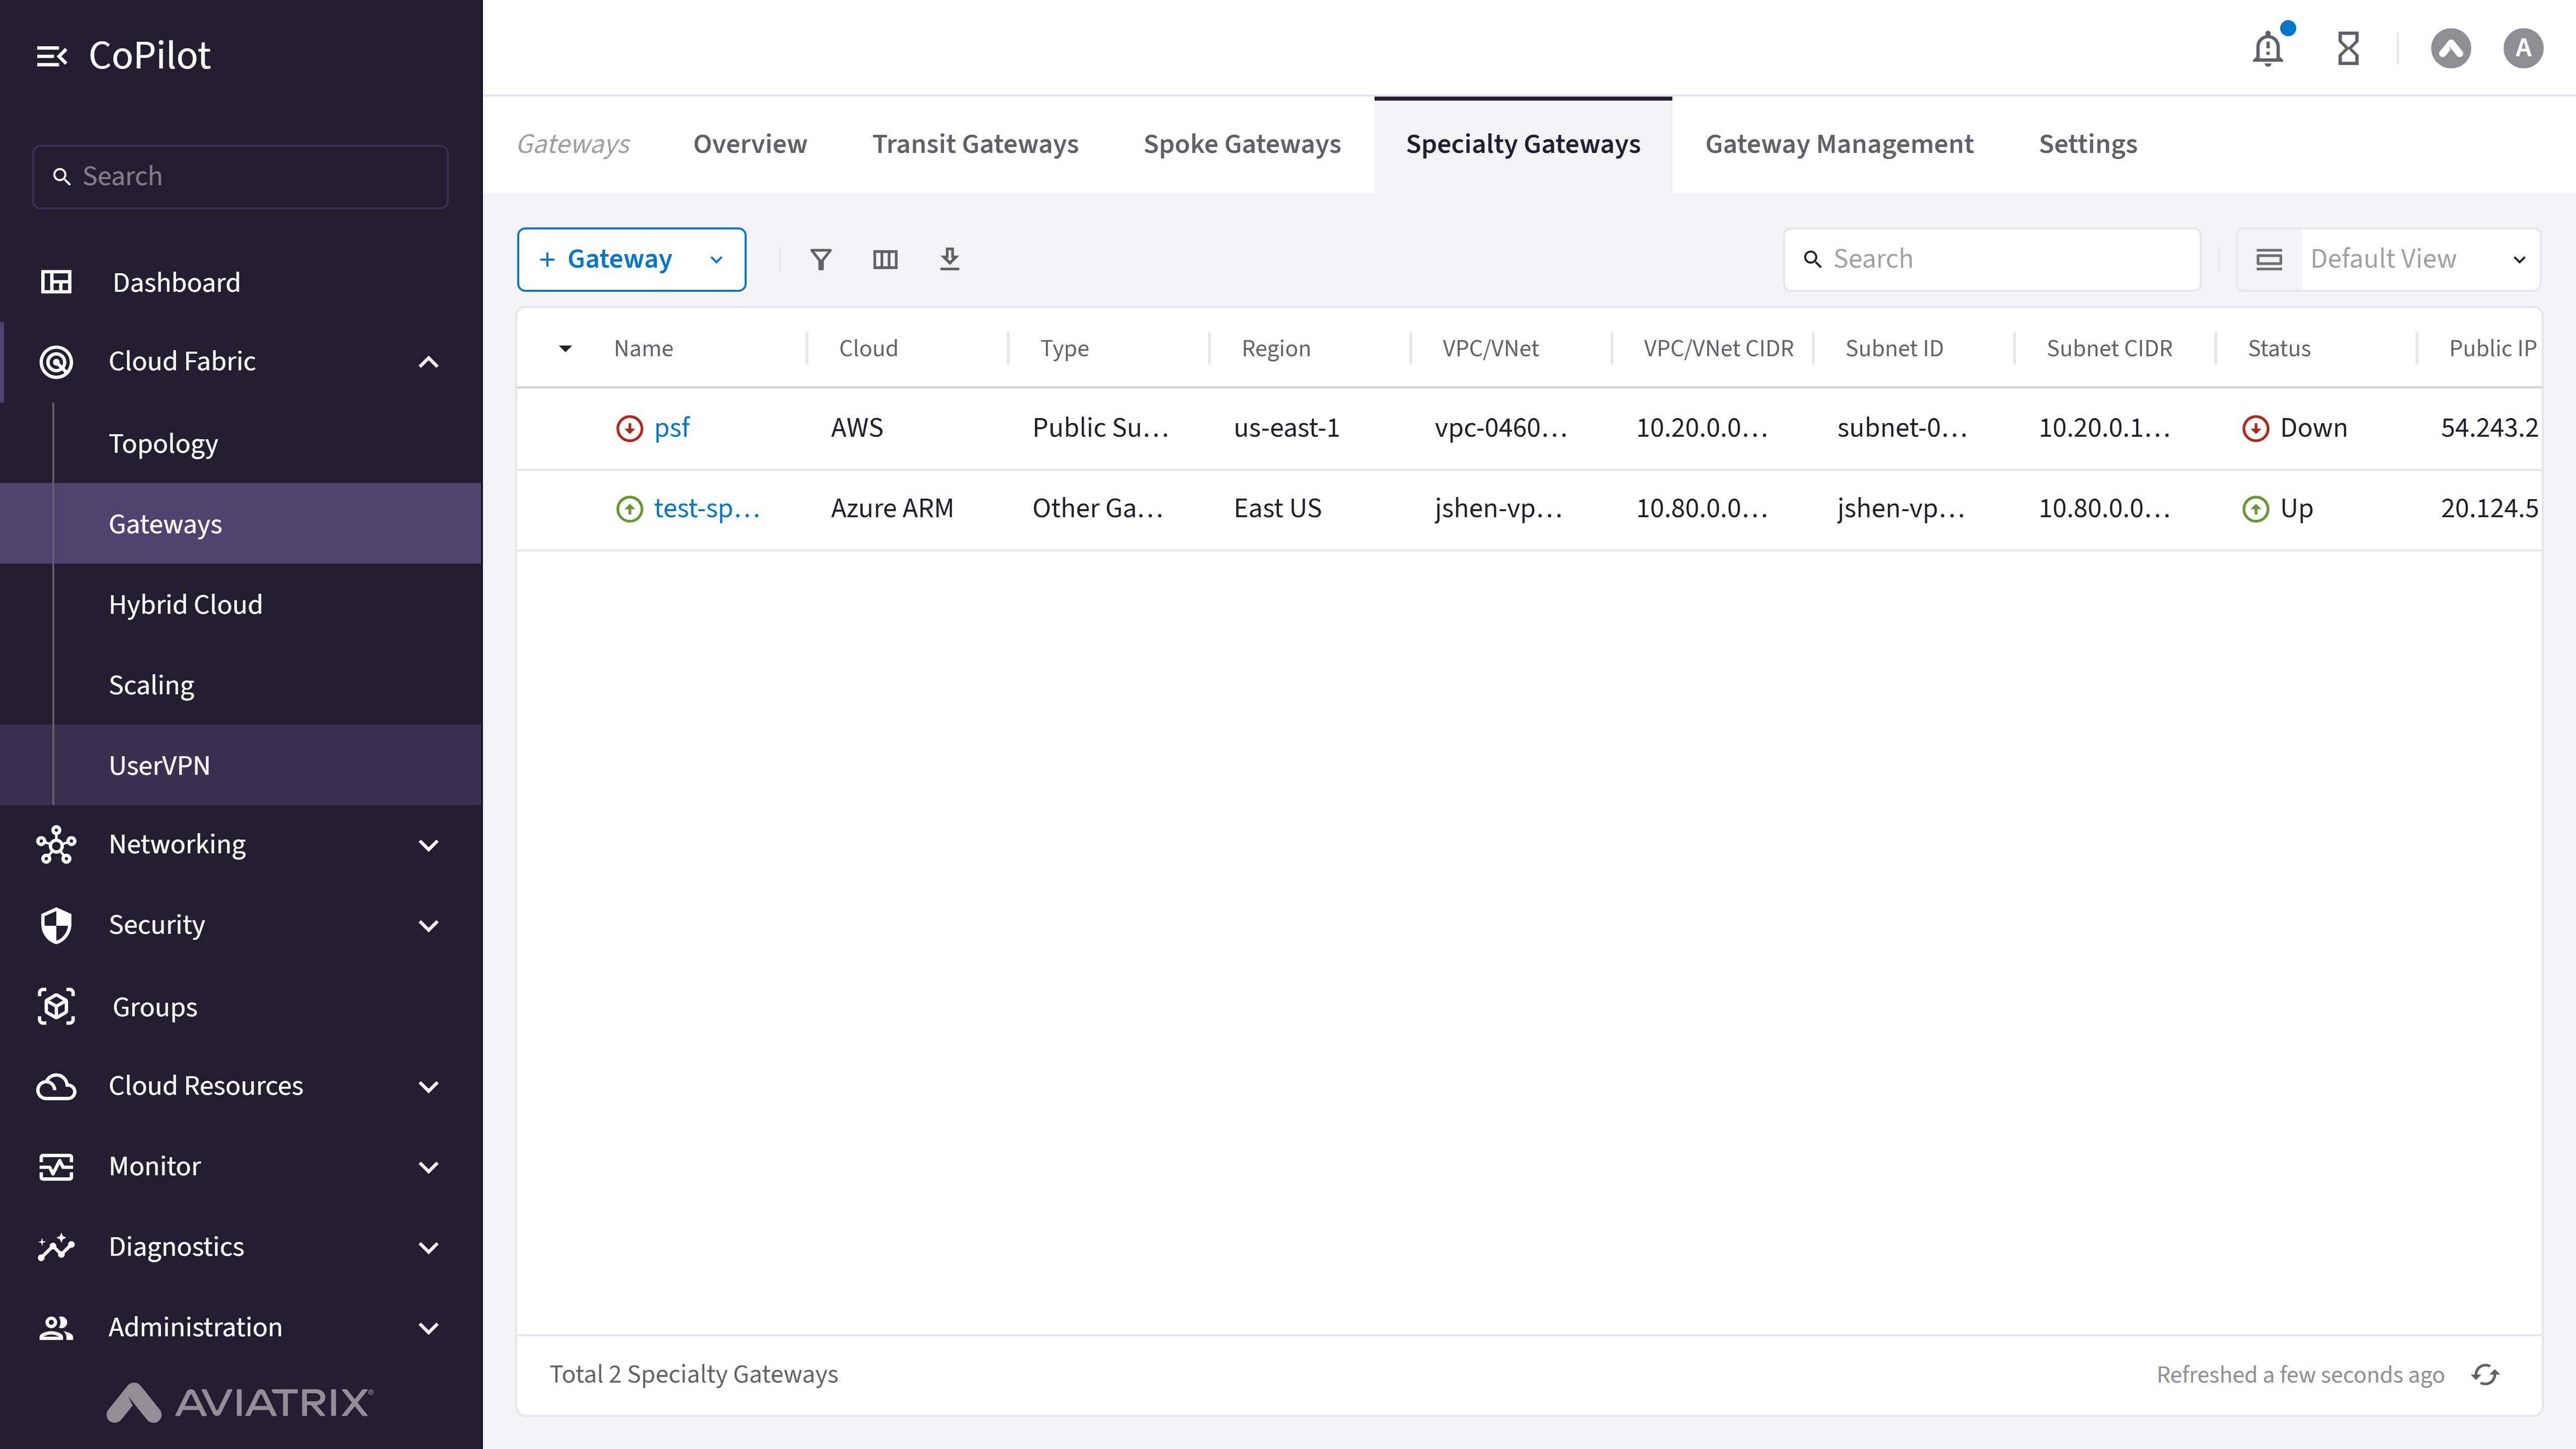
- + Gateway button: Opens a menu to add a Specialty Gateway (Public Subnet Filtering Gateway or Other).
- Specialty Gateway table: Shows the details for each Specialty Gateway (name, cloud, type, account, region, VPC/VNet, status).
- Edit button: Edits the Specialty Gateway configuration (instance size, subnet attachment, public IP).
- Actions button: Opens Gateway Diagnostics, Connectivity Diagnostics, and Resize Gateway.
- Delete button: Deletes the Specialty Gateway along with its instances and attachments.
- Gateway name link: Opens the Specialty Gateway Details page.
Actions
View Specialty Gateways
View Specialty Gateways
- Go to Cloud Fabric > Gateways > Specialty Gateways.
The Specialty Gateways page appears with a table of PSF Gateways, VPN Gateways, and FQDN Gateways. - Optionally, use the Search field or Filter icon to find a Specialty Gateway.
- Click a Specialty Gateway name to view its details.
Parameter Details
| CoPilot Parameter Name | Description |
|---|---|
| Name | Shows the name of the Specialty Gateway. |
| Cloud | Shows the cloud provider where the Gateway runs (for example, AWS, Azure, or GCP). |
| Type | Shows the Specialty Gateway type (for example, Public Subnet Filtering, VPN, or FQDN). |
| Account | Shows the cloud account that owns the Gateway. |
| Region | Shows the cloud region where the Gateway runs. |
| VPC/VNet | Shows the VPC or VNet where the Gateway runs. |
| VPC/VNet CIDR | Shows the CIDR range of the VPC or VNet. |
| Subnet ID | Shows the subnet ID where the Gateway instance runs. |
| Subnet CIDR | Shows the CIDR range of the subnet. |
| Public IP | Shows the public IP address used by the Gateway. |
| Private IP | Shows the private IP address used inside the VPC or VNet. |
| Status | Shows the current Gateway state (for example, Up or Down). |
| Configuration Status | Shows whether the Gateway configuration is Latest or Outdated. |
| Instance Size | Shows the compute size used by the Gateway instance. |
| FIPS Mode | Shows whether FIPS 140-3 compliant encryption mode is enabled on the Gateway (Controller 9.0 and later). |
Create a Specialty Gateway
Create a Specialty Gateway
- Go to Cloud Fabric > Gateways > Specialty Gateways.
A table appears with the list of Specialty Gateways. - Click + Gateway and select Other.
The Create Specialty Gateway dialog appears. - Provide the information. Refer to the Parameter Details table.
- Optionally, click + Instance to add HA instances.
- Click Save.
Parameter Details
| CoPilot Parameter Name | Description |
|---|---|
| Name | Enter a name for the Specialty Gateway. The name must start with a letter, include only letters, numbers, underscores, and dashes, and not exceed 50 characters. |
| Cloud | Select the cloud provider where the Specialty Gateway runs. |
| Account | Select the cloud account that creates the Specialty Gateway. |
| Region | Select the cloud region where the Specialty Gateway runs. |
| VPC/VNet | Select the VPC or VNet where the Specialty Gateway runs. |
| Instance Size | Select the compute size for the Specialty Gateway. |
| High Performance Encryption | Enable High Performance Encryption for the Specialty Gateway. |
| Attach to Subnet | Select the subnet where the Specialty Gateway instance runs. |
| Public IP | Assign a public IP address to the Specialty Gateway instance. |
| Resource Tags | Add key and value tags to identify the Specialty Gateway. |
Create a Public Subnet Filtering Gateway
Create a Public Subnet Filtering Gateway
- Go to Cloud Fabric > Gateways > Specialty Gateways.
A table appears with the list of Specialty Gateways. - Click + Gateway and select Public Subnet Filtering Gateway.
The Create Public Subnet Filtering Gateway dialog appears. - Provide the information. Refer to the Parameter Details table.
- Click Save.
Prior to Controller version 7.2.4820 you used AWS GuardDuty and the Egress FDQN Legacy feature to protect the public subnets and filter traffic. You should only continue using these tools if you have not purchased and enabled the DCF feature.
Parameter Details
| CoPilot Parameter Name | Description |
|---|---|
| Name | Enter a name for the PSF Gateway. The name must start with a letter, include only letters, numbers, underscores, and dashes, and not exceed 50 characters. |
| Cloud | Select the cloud provider (AWS Standard, GovCloud, or China). |
| Account | Select the cloud account that creates the PSF Gateway. |
| Region | Select the cloud region where the PSF Gateway runs. |
| VPC | Select the VPC in the selected region where the PSF Gateway runs. |
| Instance Size | Select the compute size for the PSF Gateway. The instance size must be at least t3.medium if you create a DCF rule with Intrusion Detection or TLS Decryption for the PSF Gateway. |
| Attach to Unused Subnet | Select the subnet where the PSF Gateway instance runs. The Controller creates a public subnet and route table for the PSF Gateway. |
| Route Table | Select the route tables whose associated public subnets are protected. Route tables must be selected here to be monitored and enforced by DCF rules. |
| Resource Tags | Add key and value tags to identify the PSF Gateway. |
Edit a Specialty Gateway
Edit a Specialty Gateway
- Go to Cloud Fabric > Gateways > Specialty Gateways.
A table appears with the list of Specialty Gateways. - Locate the Specialty Gateway and click the Edit icon on the row.
The Edit Specialty Gateway or Edit PSF Specialty Gateway dialog appears. - Change the editable parameters (Instance Size, subnet attachment, Public IP).
- Click Save.
Parameter Details
| CoPilot Parameter Name | Description |
|---|---|
| Instance Size | Change the compute size of the Specialty Gateway. |
| Attach to Subnet | Attach a subnet to a new HA instance. |
| Public IP | Select a public IP for a new HA instance. |
Delete a Specialty Gateway
Delete a Specialty Gateway
- Go to Cloud Fabric > Gateways > Specialty Gateways.
A table appears with the list of Specialty Gateways. - Remove any attachments to other Specialty Gateways before deleting.
- Locate the Specialty Gateway and click the Delete icon on the row.
The Delete Specialty Gateway or Delete PSF Specialty Gateway dialog appears. - Read the warning message and tick the checkbox to confirm the deletion.
- Click Delete.
Configure Public Subnet Filtering Gateway Settings
Configure Public Subnet Filtering Gateway Settings
- Go to Cloud Fabric > Gateways > Specialty Gateways.
A table appears with the list of Specialty Gateways. - Locate the PSF Gateway and click the Edit icon on the row to update create-time settings, or click the gateway name to open the details and then click the Settings tab for advanced settings.
- Update the required settings. Refer to the Parameter Details table.
- Click Save.
Parameter Details
| CoPilot Parameter Name | Description |
|---|---|
| Account | Select the cloud account that the Controller uses to launch and manage the PSF Gateway through API calls. |
| Region | Select the region where the PSF Gateway runs. Use the same region as the target VPC. |
| VPC | Select the VPC where the PSF Gateway runs. Use a VPC in the selected region. |
| Instance Size | Select the compute size for the PSF Gateway. |
| Attach to Unused Subnet | Select the public subnet where the PSF Gateway runs. In AWS, use a subnet whose route table has a default route to the internet gateway. |
| Route Table | Select the route tables whose associated public subnets are protected. Select route tables here for Distributed Cloud Firewall policy monitoring and enforcement when the PSF Gateway participates in those rules. |
| Network Address Translation (NAT) | Configure source and destination network address translation behavior for PSF traffic flows from the gateway settings area. |
| Gateway Management DNS Server | Select the DNS source the Gateway uses for management lookups (Aviatrix default DNS or cloud VPC/VNet DNS). |
| Jumbo Frames | Enable or disable jumbo frames to optimize throughput where supported. |
| GRO/GSO | Enable or disable Generic Receive Offload and Generic Segmentation Offload for Gateway interfaces. |
| Single AZ Gateway HA | Enable or disable single availability zone high-availability behavior. |
| RX Queue Size | Configure the receive queue size for Gateway interfaces as needed for traffic profiles. |
| Instance Size | Expected Throughput |
|---|---|
| AWS Performance | |
| T2 series | Not guaranteed; can burst up to 130 Mbps |
| c5.2xlarge | 2 to 2.5 Gbps |
| c5.4xlarge | 2 to 2.5 Gbps |
| c5n.4xlarge | 25 Gbps with HPE Mode |
| c5n.9xlarge | 70 Gbps with HPE Mode |
| c5n.18xlarge | 70 Gbps with HPE Mode |
| AWS Storage | EBS gp3 or gp2 volumes supported. To change volume, refer to AWS documentation. |
| Azure Performance (without HPE Mode) | |
| B series | Burstable, up to 260 Mbps |
| D / Ds series | 480 Mbps to 1.2 Gbps |
| F series | Approximately 450 Mbps to 1.2 Gbps. |
| GCP Performance (Without HPE) | |
| n1-standard-1 | 1.0 to 1.2 Gbps |
| n1-standard-2 | 1.0 to 1.2 Gbps |
| n1-highcpu-2 | 1.0 to 1.2 Gbps |
| n1-standard-4 | 2.3 to 2.5 Gbps |
| n1-highcpu-2 | 2.3 to 2.5 Gbps |
| OCI Performance | |
| VM.Standard2.2 or larger |
|
| OCI Flexible Shapes: E4 | |
| FLEX4.16 | 4 OCPU, 16 GB RAM |
| FLEX8.32 | 8 OCPU, 32 GB RAM |
| FLEX16.32 | 16 OCPU, 32 GB RAM |
| OCI Flexible Shapes: E5 | |
| FLEX4.16 | 4 OCPU, 16 GB RAM |
| FLEX8.32 | 8 OCPU, 32 GB RAM |
| FLEX16.32 | 16 OCPU, 32 GB RAM |
| OCI Flexible Shapes: E6 | |
| FLEX4.16 | 4 OCPU, 16 GB RAM |
| FLEX8.32 | 8 OCPU, 32 GB RAM |
| FLEX16.32 | 16 OCPU, 32 GB RAM |
- Software Upgrade
- Image Upgrade
- Gateway Rollback
Purpose
The Software Upgrade page shows a table of Aviatrix gateways and their current software versions, allowing for bulk software upgrades.Elements
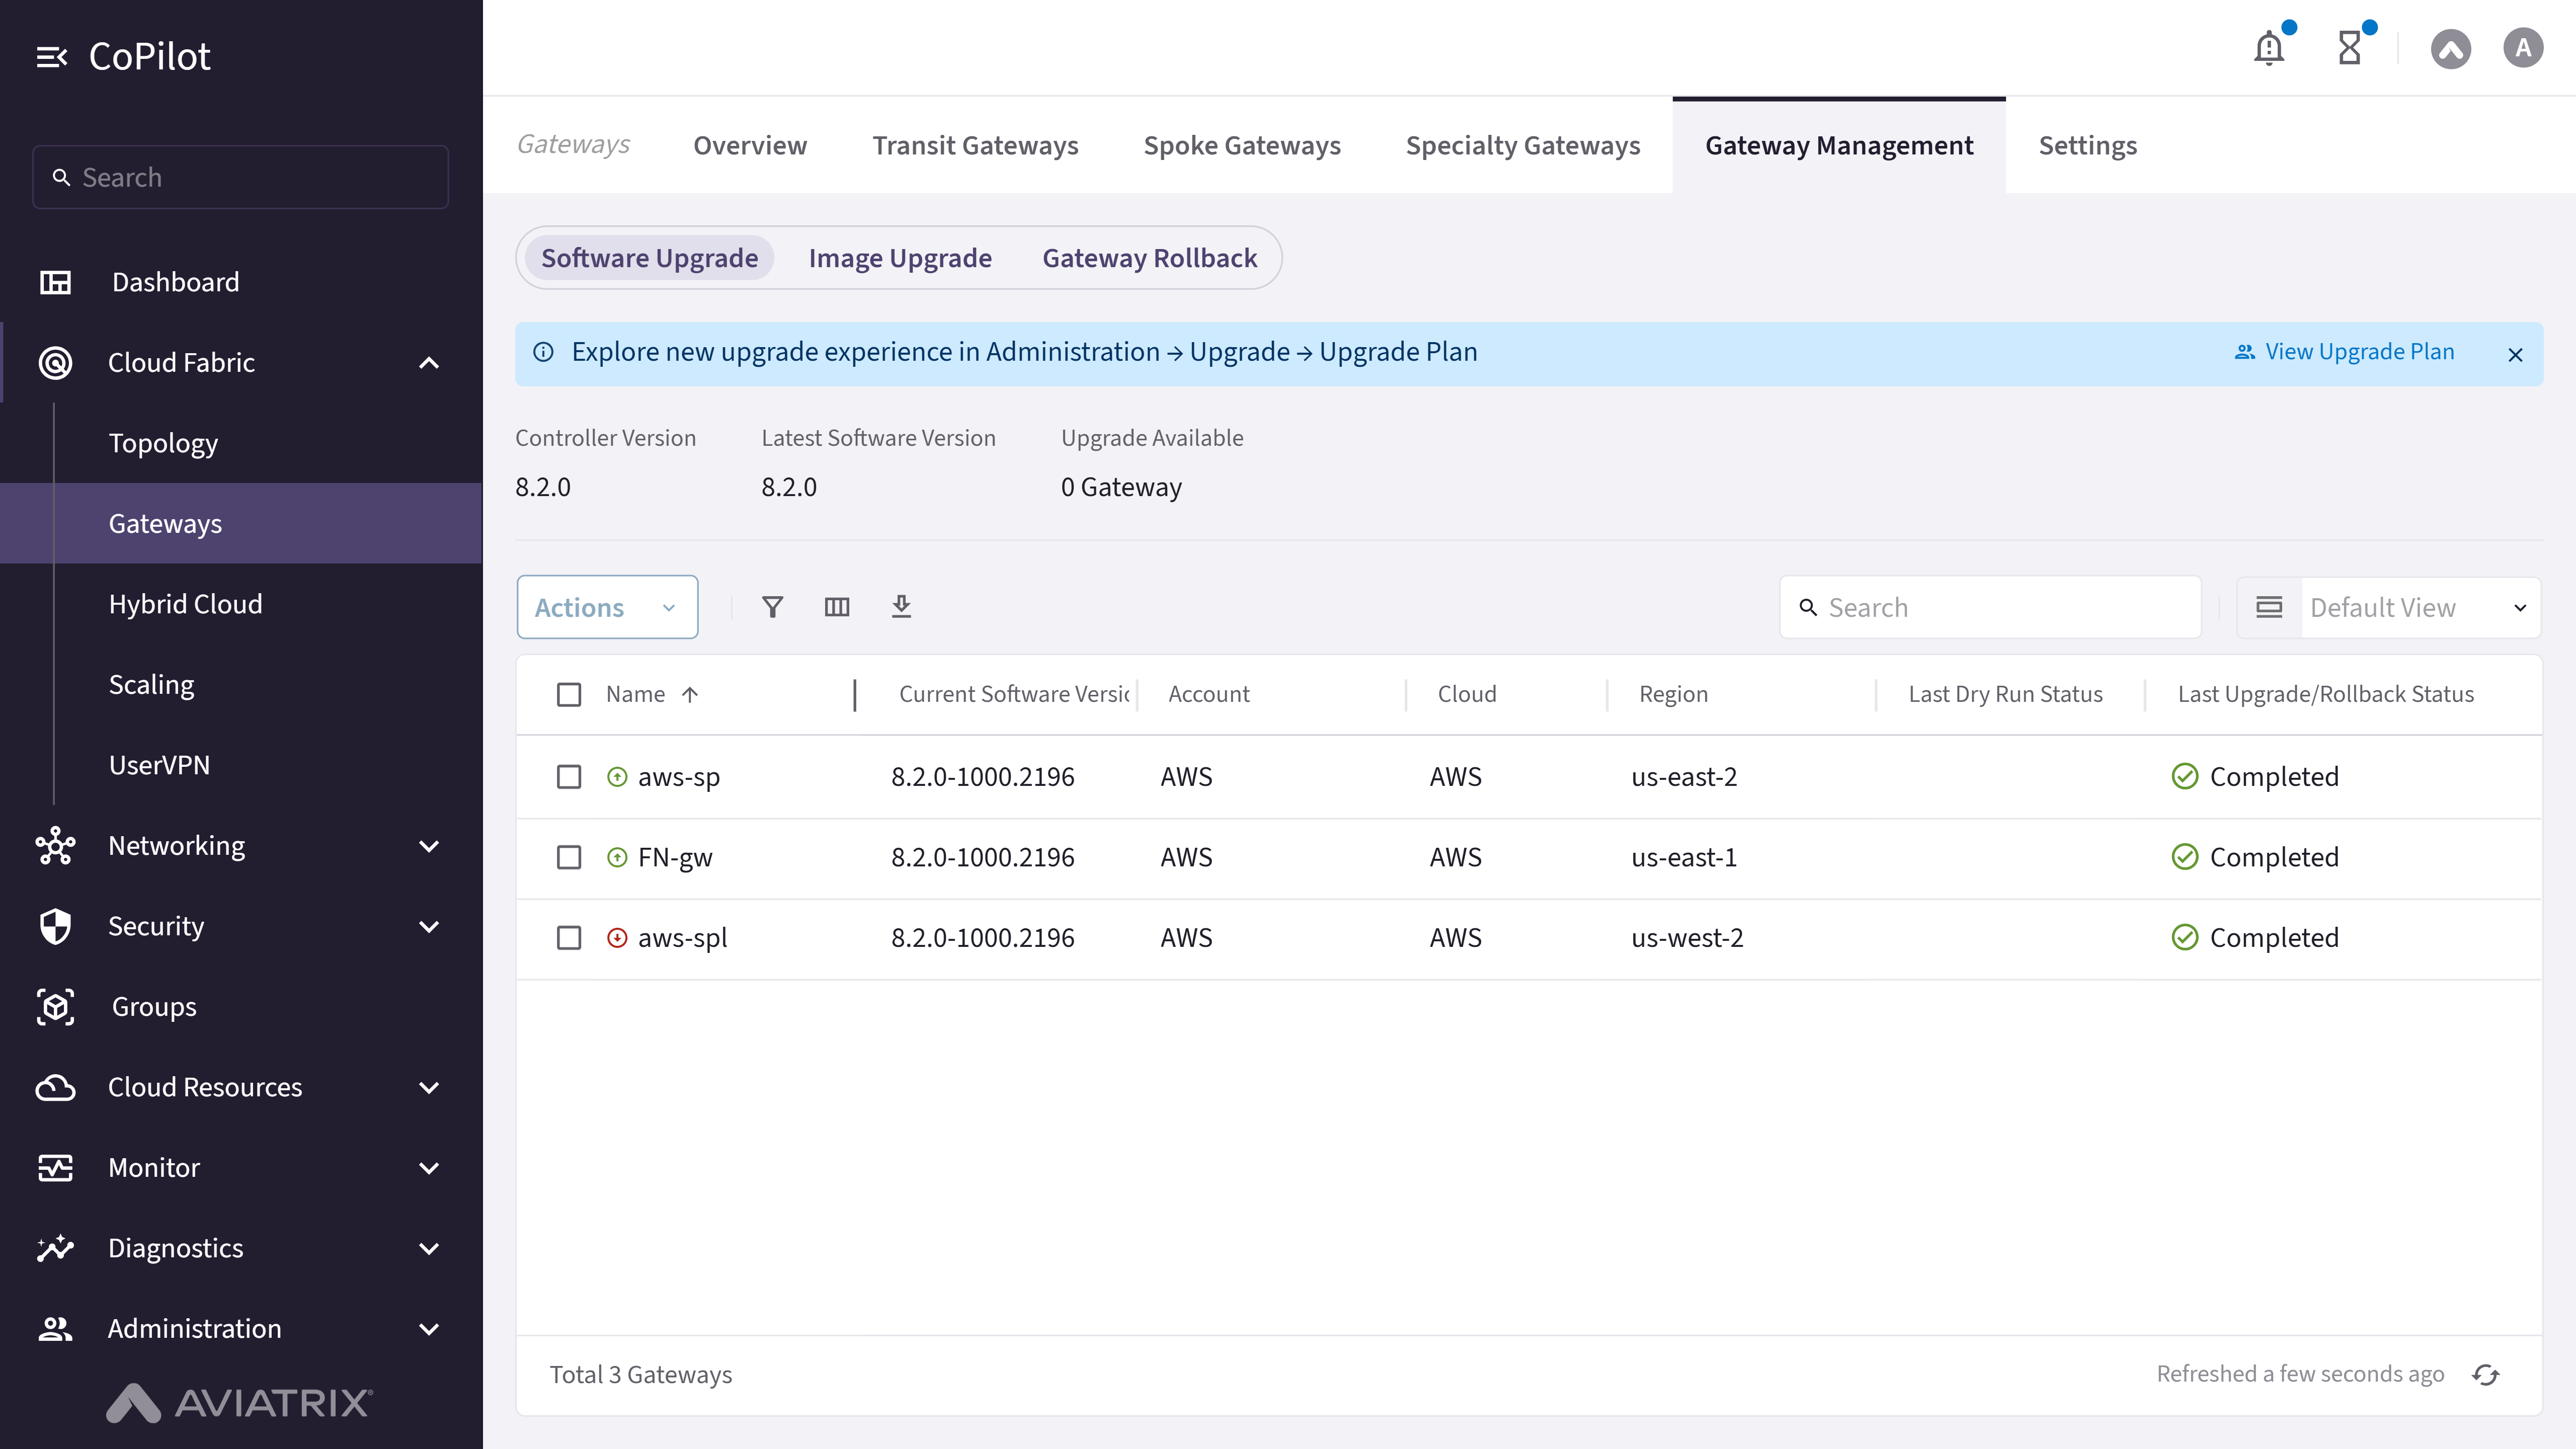
- Status Indicators: Displays Controller Version, Latest Software Version, and Upgrade Available count for gateways.
- Upgrade Controller button: Upgrades the Aviatrix Controller software to the latest version.
- Software Upgrade table: Displays the Current Software Version for each gateway and the parameters in the following Parameter Details section.
- Checkbox: Selects individual gateways for software upgrade.
- Actions button: Provides options for Dry Run and Upgrade Software for the selected gateways.
- Dry Run: Simulates the upgrade process to validate compatibility before execution.
- Upgrade Software: Initiates the software upgrade.
Actions
View Software Upgrade
View Software Upgrade
- Go to Cloud Fabric > Gateways > Gateway Management > Software Upgrade.
The Software Upgrade page appears with status indicators (Controller Version, Latest Software Version, Upgrade Available count) and a table of gateways with their current and available versions. - Optionally, use the Search field or Filter icon to find a gateway.
Parameter Details
| CoPilot Parameter Name | Description |
|---|---|
| Name | Shows the name of the gateway. |
| Current Software Version | Shows the software version currently running on the gateway. |
| Available Version | Shows the latest version available for upgrade. |
| Dry Run Status | Shows the status of the most recent dry run (for example, Passed or Failed). |
| Upgrade Status | Indicates whether the upgrade completed successfully. |
Run Dry Run
Run Dry Run
- Go to Cloud Fabric > Gateways > Gateway Management > Software Upgrade.
A table appears with the list of gateways. - Select the checkboxes for the gateways to validate.
- Click Actions and select Dry Run.
Upgrade Software
Upgrade Software
- Go to Cloud Fabric > Gateways > Gateway Management > Software Upgrade.
A table appears with the list of gateways. - Select the checkboxes for the gateways to upgrade.
- Click Actions and select Upgrade Software.
Purpose
The Image Upgrade page shows a table of Aviatrix gateways and their current image versions, allowing for bulk image upgrades.Elements
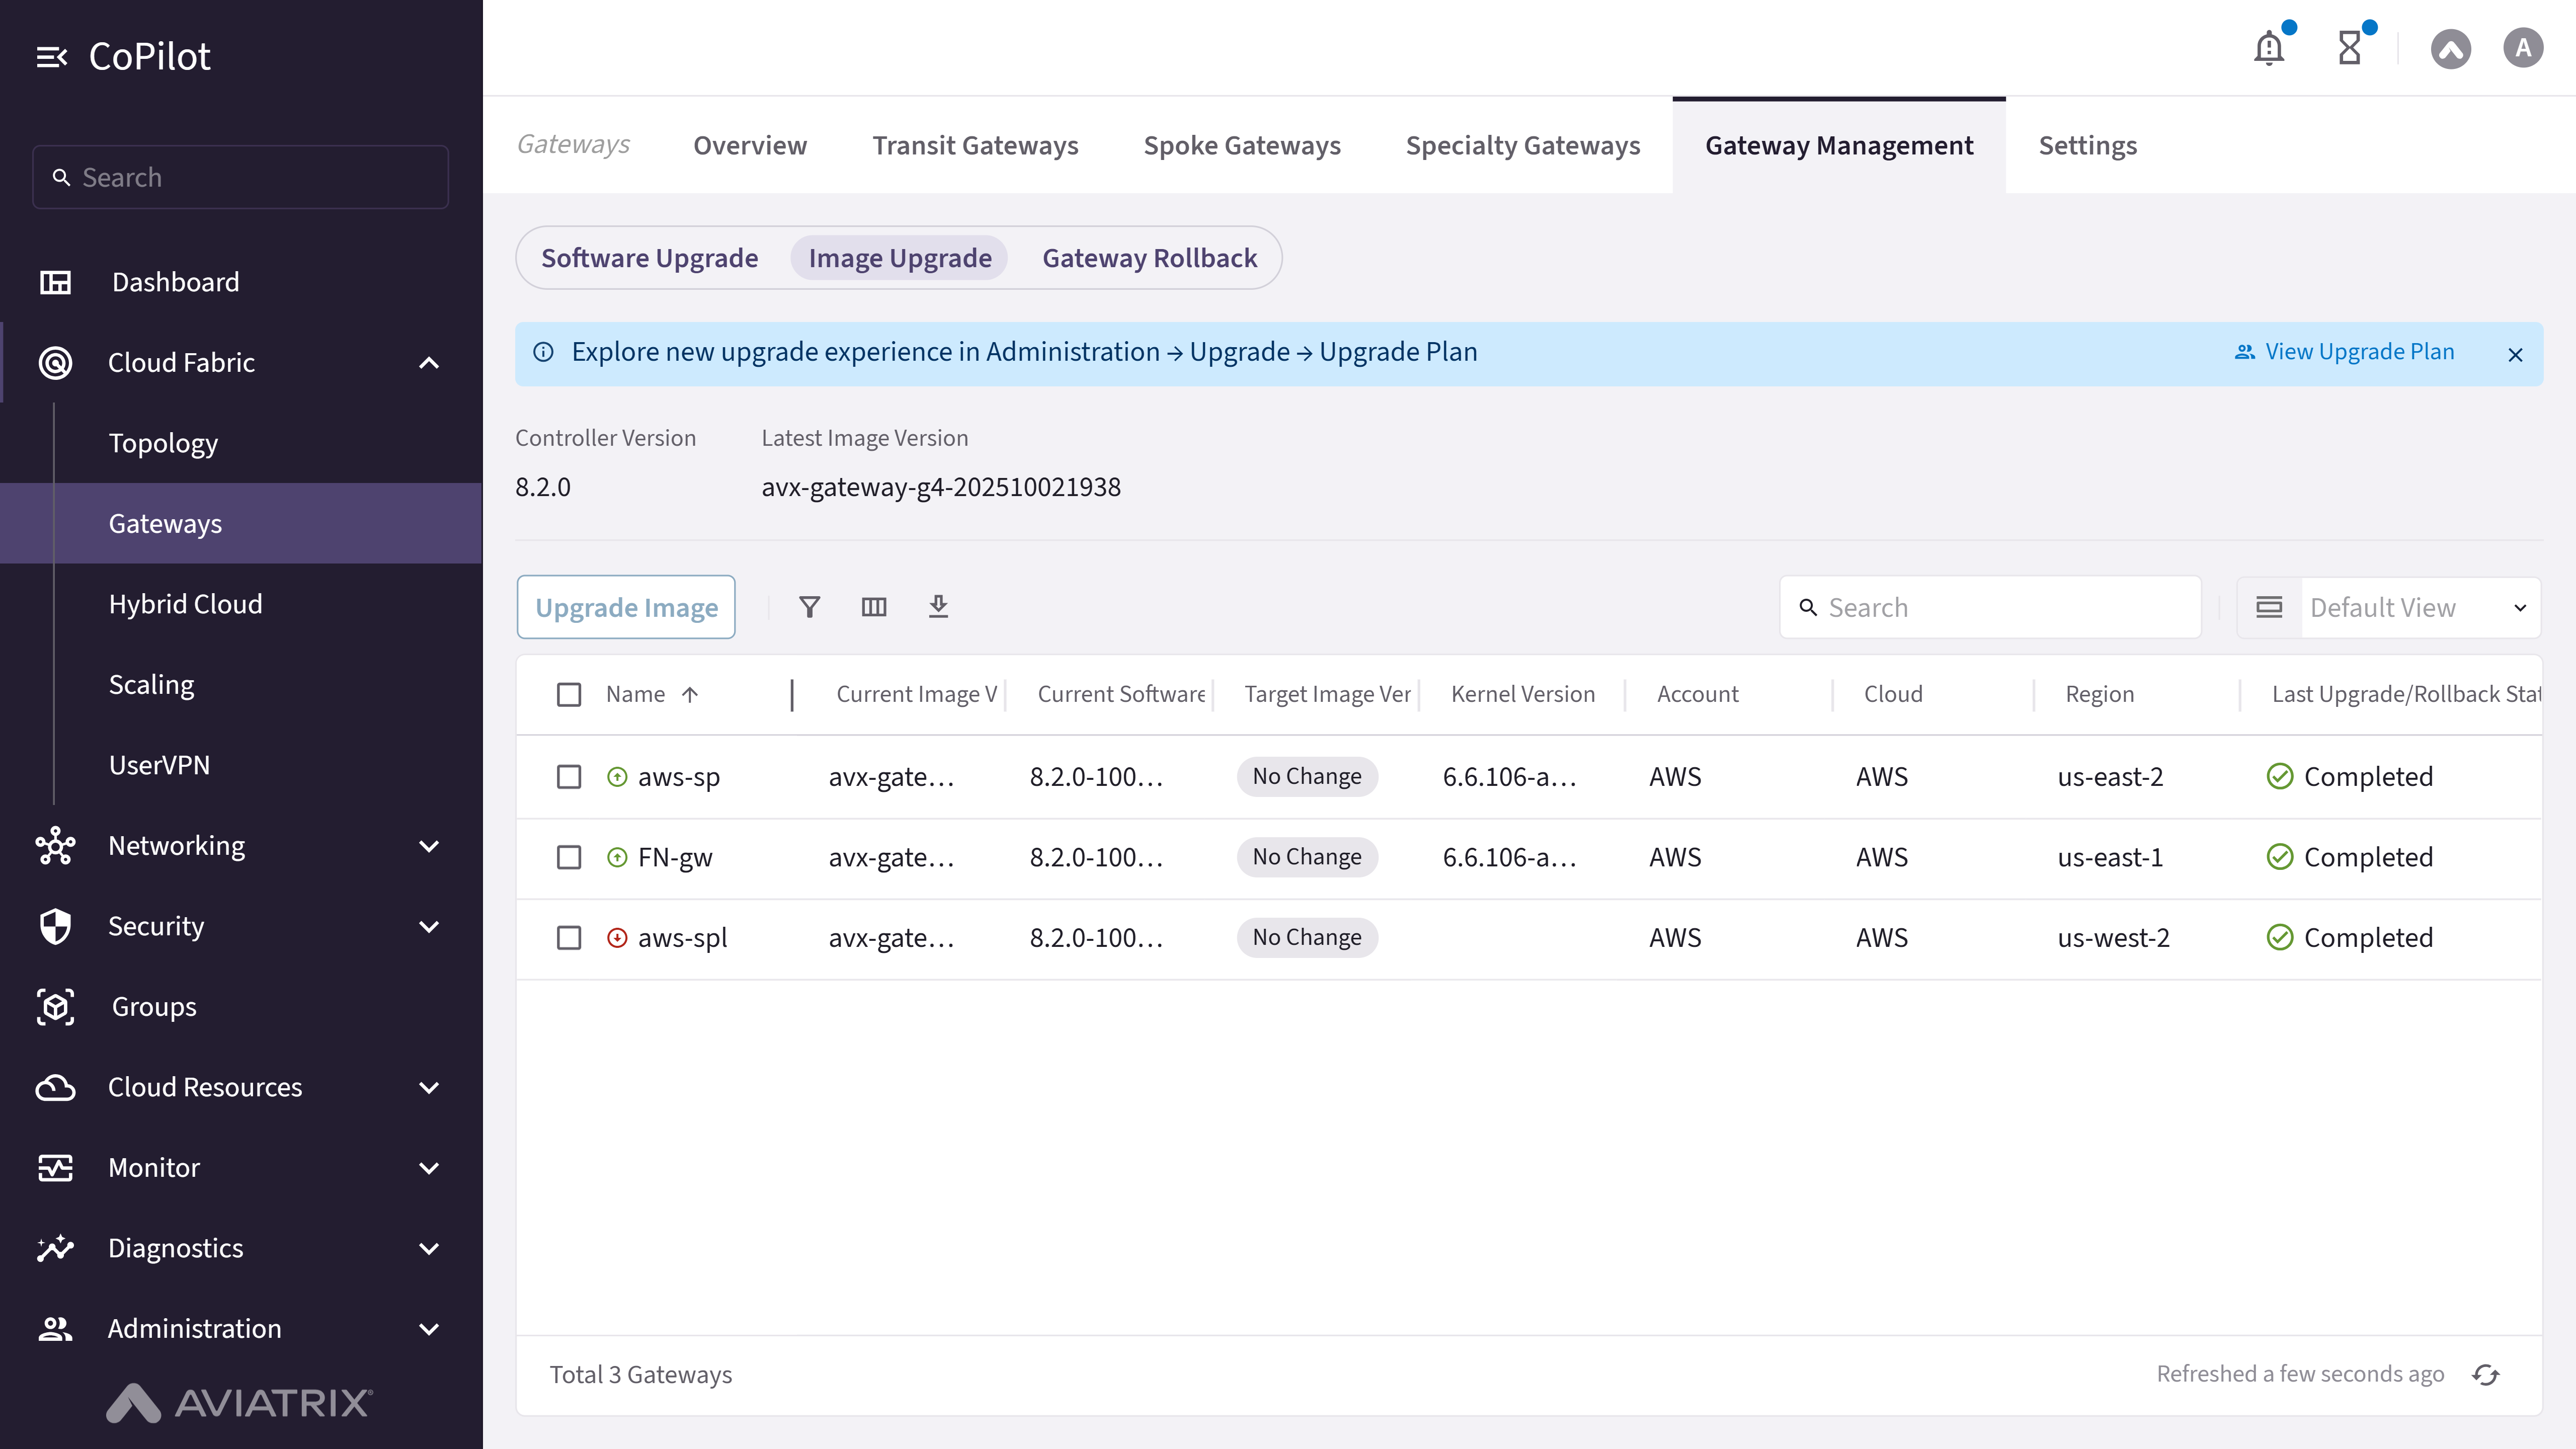
- Status Indicators: Displays Controller Version, Latest Image Version, and Upgrade Available count for gateways.
- Upgrade Controller button: Upgrades the Aviatrix Controller image to the latest version.
- Image Upgrade table: Displays the Current Image Version for each gateway and the parameters in the following Parameter Details section.
- Checkbox: Selects individual gateways for image upgrade.
- Upgrade Image button: Upgrades image for the selected gateways.
Actions
View Image Upgrade
View Image Upgrade
- Go to Cloud Fabric > Gateways > Gateway Management > Image Upgrade.
The Image Upgrade page appears with status indicators (Controller Version, Latest Image Version, Upgrade Available count) and a table of gateways with their current and available image versions. - Optionally, use the Search field or Filter icon to find a gateway.
Parameter Details
| CoPilot Parameter Name | Description |
|---|---|
| Name | Shows the name of the gateway. |
| Current Image Version | Shows the image version currently running on the gateway. |
| Available Image Version | Shows the latest image version available for upgrade. |
| Dry Run Status | Shows the status of the most recent dry run for image upgrade. |
| Upgrade Status | Indicates whether the image upgrade completed successfully. |
Upgrade Image
Upgrade Image
- Go to Cloud Fabric > Gateways > Gateway Management > Image Upgrade.
A table appears with the list of gateways. - Select the checkboxes for the gateways to upgrade.
- Click Upgrade Image.
- Monitor the progress in the status window.
Purpose
The Gateway Rollback page shows a table of Aviatrix gateways and their current and rollback software versions, and current and rollback image versions, allowing for bulk rollback operations.Elements
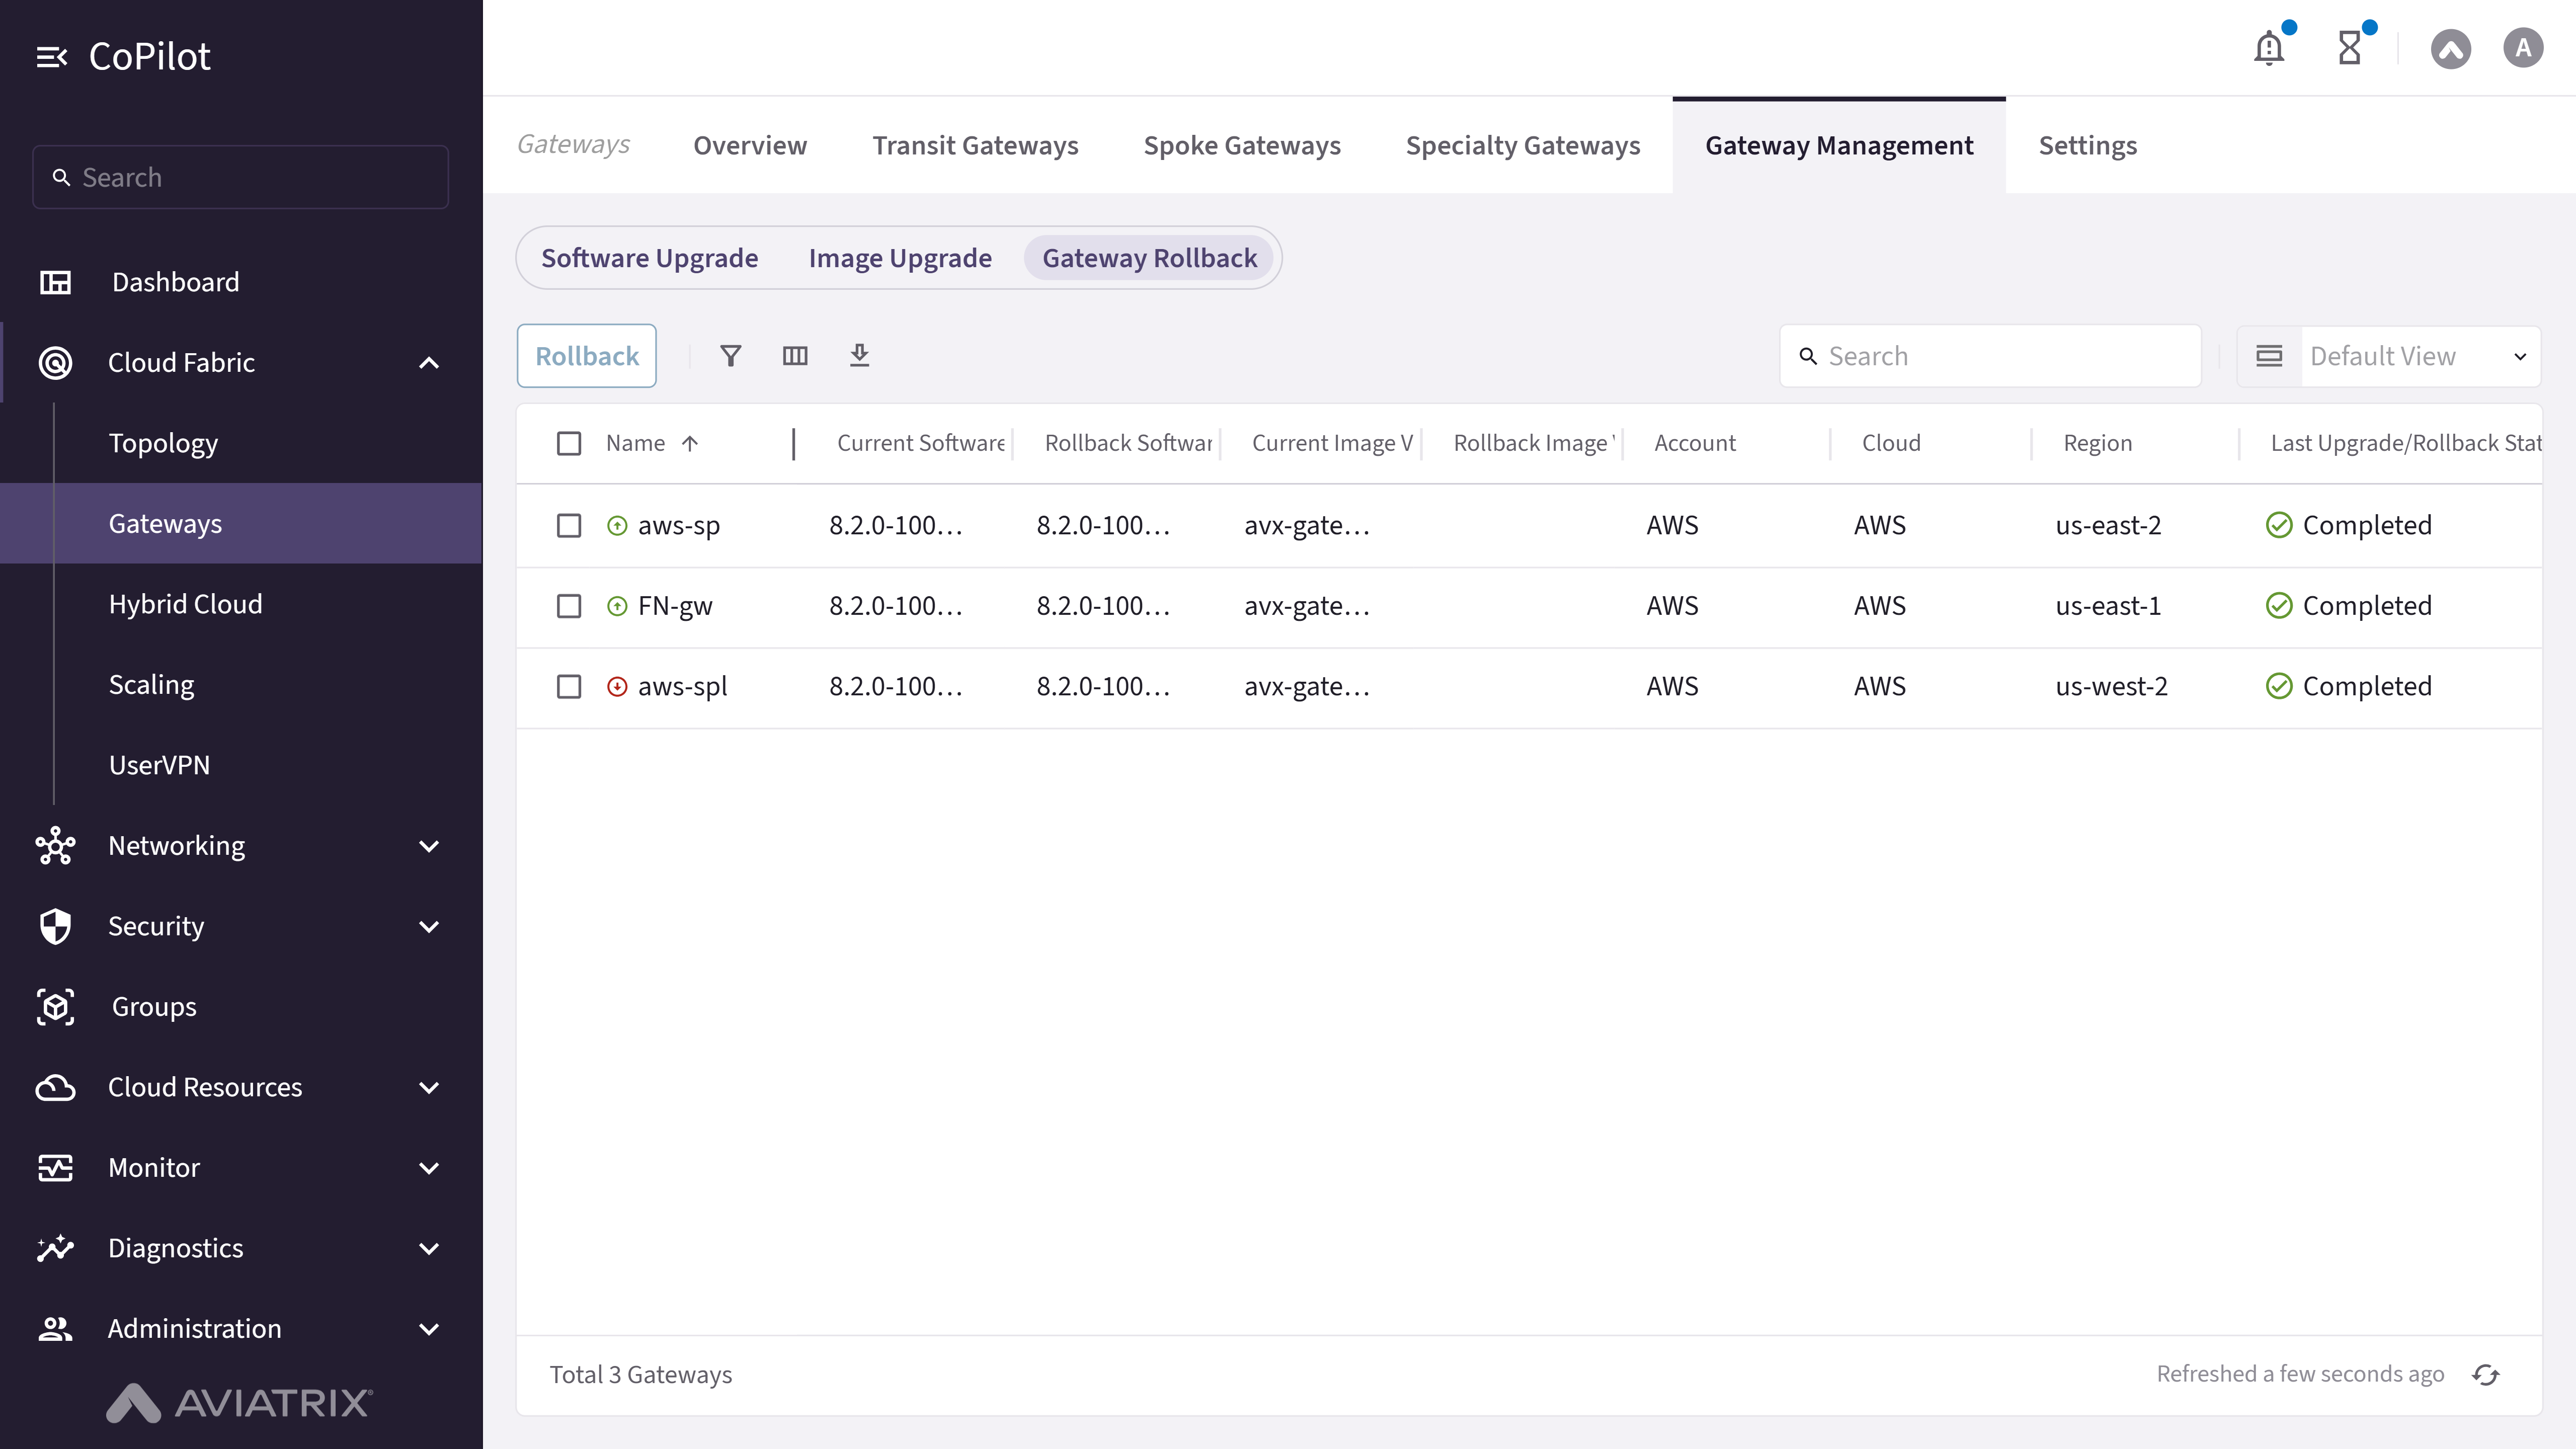
- Rollback button: Starts the rollback process for the selected gateways.
- Gateway Rollback table: Displays the Current Software Version, Rollback Software Version, Current Image Version, and Rollback Image Version for each gateway and the parameters in the following Parameter Details section.
- Checkbox: Selects individual gateways for rollback.
Actions
View Gateway Rollback
View Gateway Rollback
- Go to Cloud Fabric > Gateways > Gateway Management > Gateway Rollback.
The Gateway Rollback page appears with a table of gateways showing current and rollback software and image versions. - Optionally, use the Search field or Filter icon to find a gateway.
Parameter Details
| CoPilot Parameter Name | Description |
|---|---|
| Name | Shows the name of the gateway. |
| Previous Version | Shows the version available for rollback. |
| Rollback Status | Indicates whether the rollback completed successfully. |
| Last Upgrade Status | Shows the status of the most recent upgrade before rollback. |
Roll Back Gateway
Roll Back Gateway
- Go to Cloud Fabric > Gateways > Gateway Management > Gateway Rollback.
A table appears with the list of Gateways and their rollback versions. - Select the checkboxes for the Gateways to roll back.
- Click Rollback.
Purpose
The Settings page shows GCP Global VPC Configuration, Rollback On Gateway Creation Error, Global BGP Communities Support, Global Smart Gateways Support, and other settings for Aviatrix Gateways.Elements
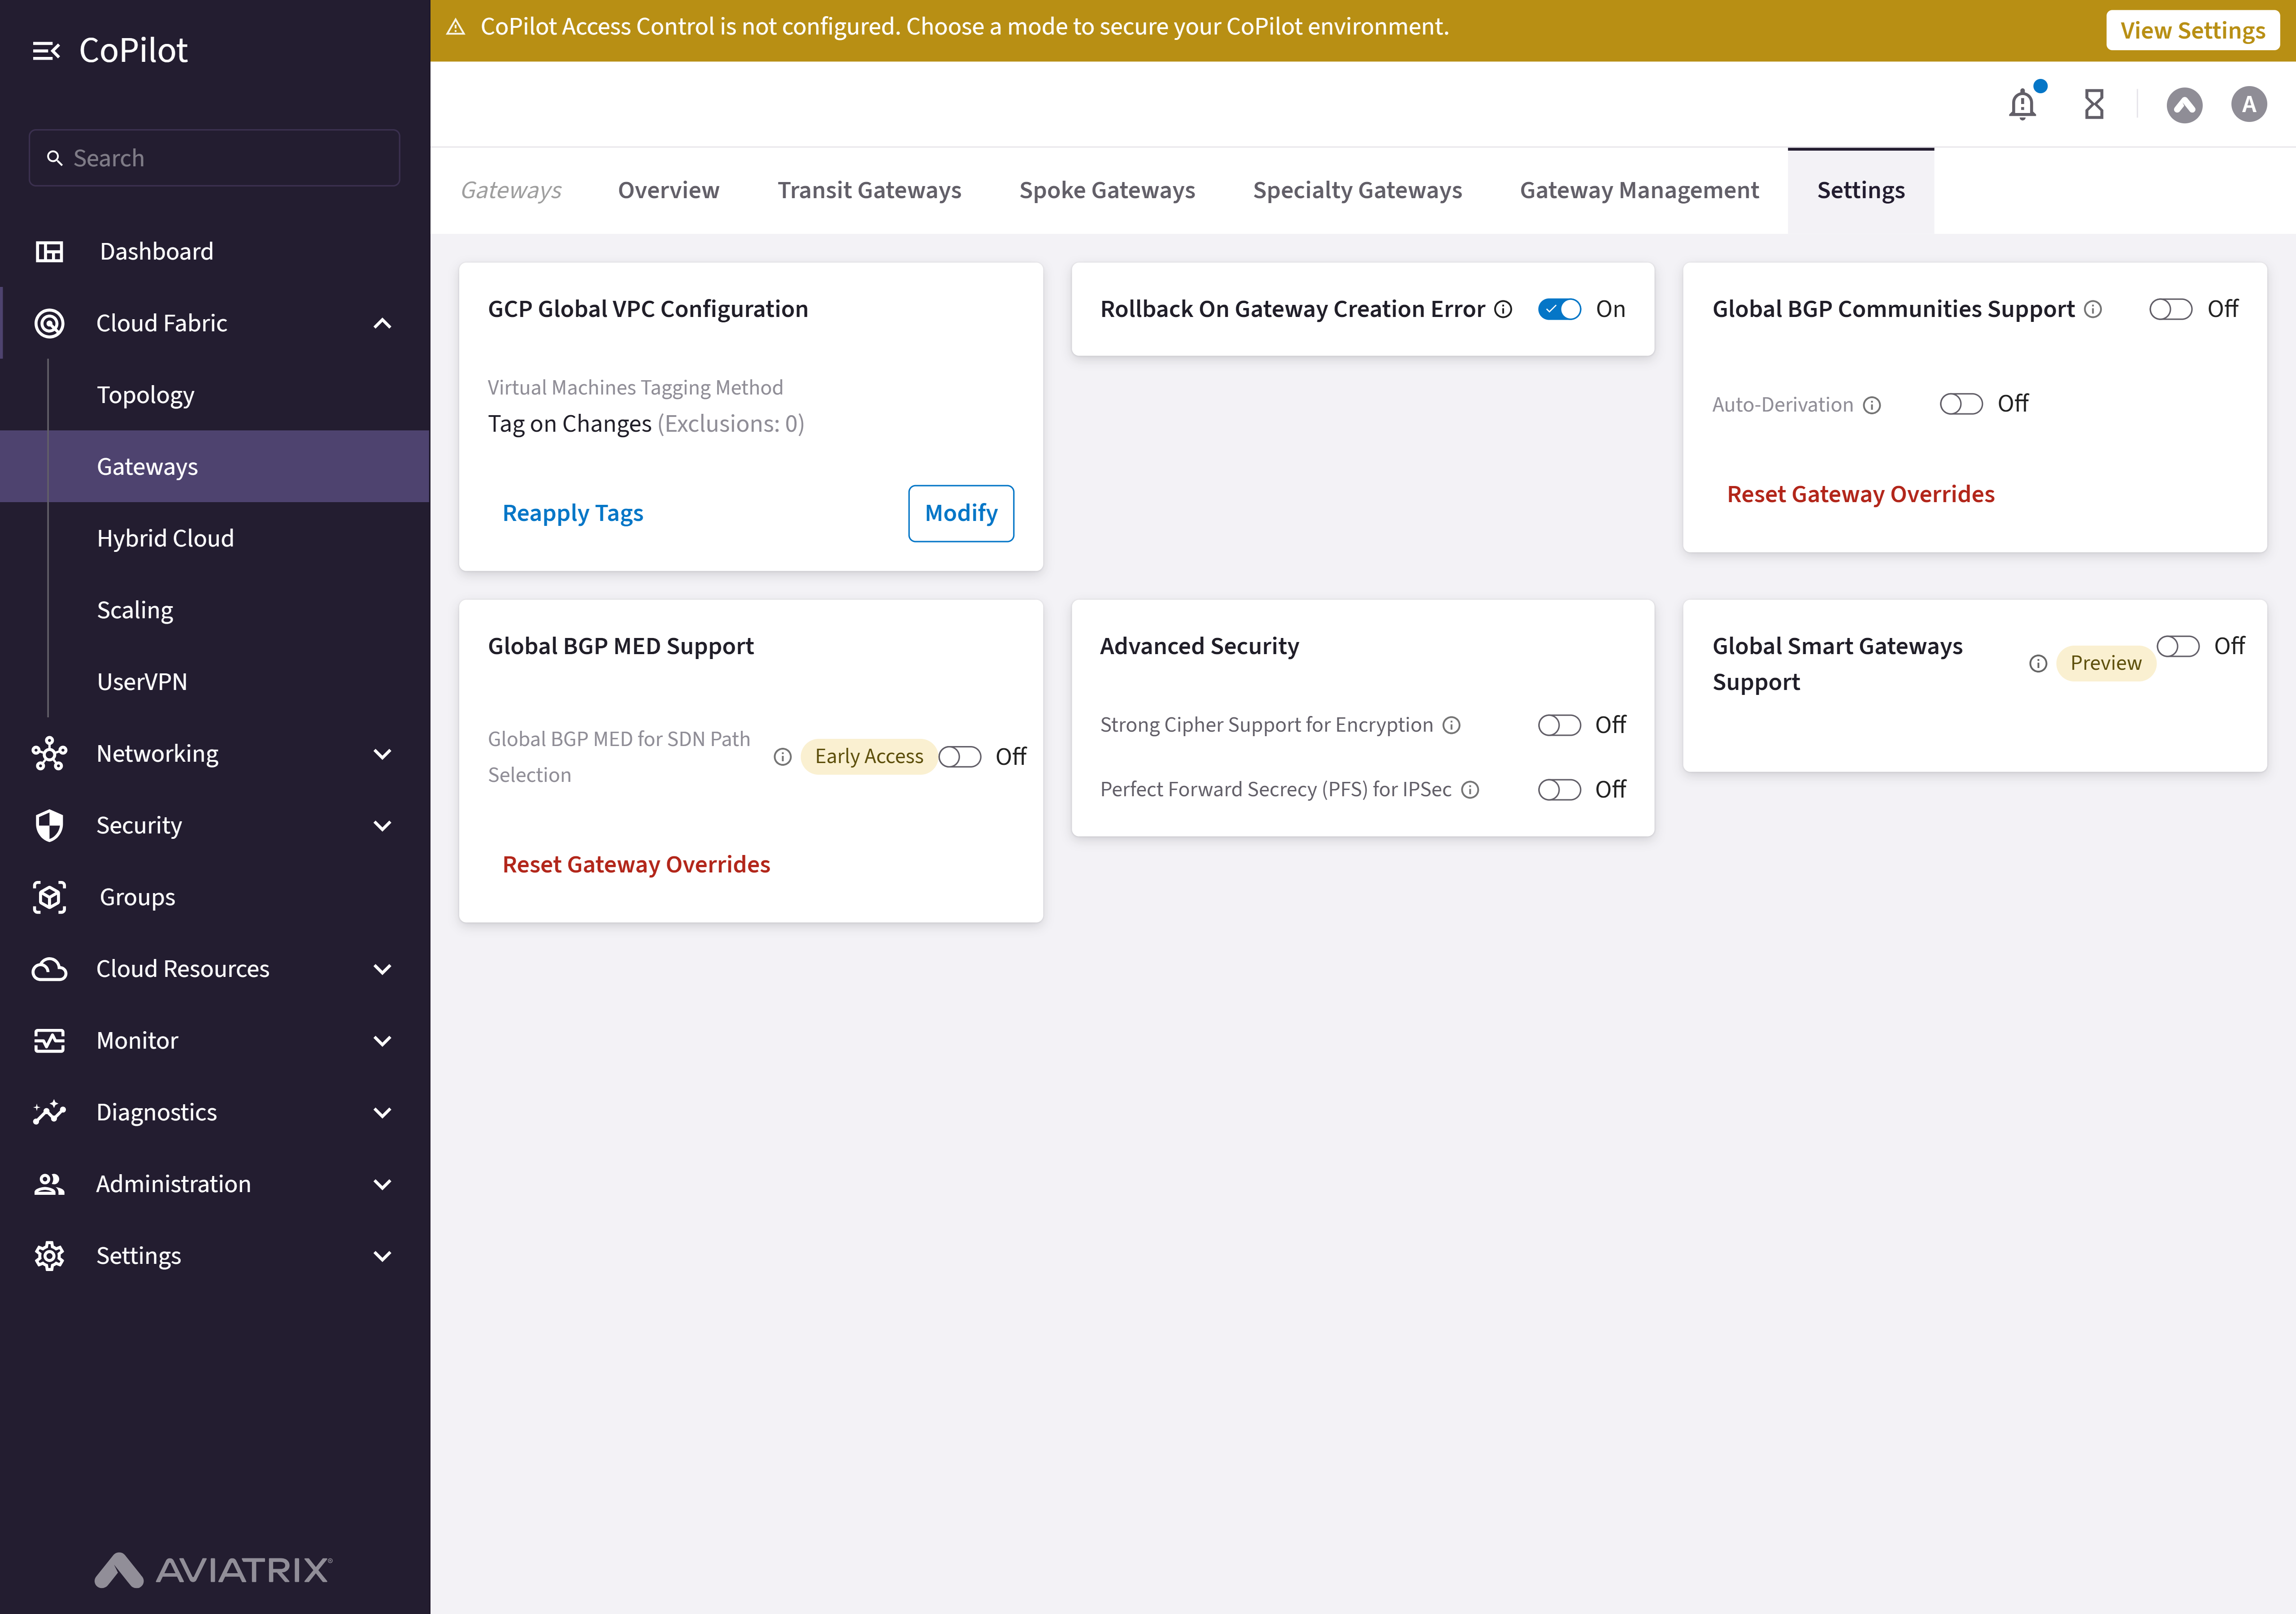
- GCP Global VPC Configuration card: Section to configure global VPC settings to tag VMs in GCP.
- Rollback On Gateway Creation Error toggle: Option to enable automatic rollback if gateway creation fails.
- Global BGP Communities Support card: Option to enable or disable global BGP communities support across gateways.
- Auto Derivation toggle: Toggle to enable or disable automatic assignment of BGP communities to routes.
- Reset Gateway Overrides button: Button to reset any custom gateway overrides to default settings.
- Global Smart Gateways Support card: Enables the Smart Gateways Preview feature so gateways can compute and steer traffic via their own routing paths, without relying on the Controller.
- Underlay Mesh Connectivity toggle: Enables BGP peering between gateways and their neighbors to share routing information. Required for Smart Gateways to function.
- Smart Gateways count and Other Gateways count: Shows how many gateways currently route locally through Smart Gateways versus use Controller-managed routing.
- Rollout Smart Gateways button: Opens a dialog to select which gateways route traffic locally through Smart Gateways.
Actions
Configure Advanced Security (IPsec)
Configure Advanced Security (IPsec)
Edit IPsec Settings: New Deployments
Edit IPsec Settings: New Deployments
- Spoke-to-Transit
- Transit-to-Transit
- Transit-to-FQDN
- Transit-to-Edge-as-Spoke
| Configuration | Encryption Algorithm |
|---|---|
| Strong Cipher is enabled; PFS is enabled | AES-256-GCM with DH21 |
| Strong Cipher is enabled; PFS is disabled | AES-256-GCM without PFS |
| Strong Cipher is disabled; PFS is enabled | AES-128-GCM with DH21 |
| Strong Cipher is disabled; PFS is disabled | AES-128-GCM only |
- Go to Cloud Fabric > Gateways > Settings > Advanced Security.
- Turn On Strong Cipher Support for Encryption.
- Turn On Perfect Forward Secrecy (PFS) for IPSec.
- Read and understand the warning message, and tick the checkbox to confirm the changes.
- Click Save.
Parameter Details
| CoPilot Parameter Name | Description |
|---|---|
| GCP Global VPC Configuration | Settings for global VPC configuration in GCP, including VM tagging method. |
| Virtual Machines Tagging Method | Defines how tags are applied to virtual machines (e.g., Tag on Changes). |
| Rollback on Gateway Creation Error | Enables automatic rollback if gateway creation fails. |
| Global BGP Communities Support | Toggles support for global BGP communities across gateways. |
| Auto Derivation | Enables or disables automatic derivation of BGP settings. |
| Reset Gateway Overrides | Resets any custom gateway overrides to default settings. |
| Alert Thresholds | Configures CPU, memory, and bandwidth thresholds for alerts. |
| Upgrade Mode | Defines upgrade behavior (manual or automatic) for gateways. |
Edit IPsec Settings: Existing Deployments
Edit IPsec Settings: Existing Deployments
- Spoke-to-Transit
- Transit-to-Transit
- Transit-to-FQDN
- Transit-to-Edge-as-Spoke
| Configuration | Encryption Algorithm |
|---|---|
| Strong Cipher is enabled; PFS is enabled | AES-256-GCM with DH21 |
| Strong Cipher is enabled; PFS is disabled | AES-256-GCM without PFS |
| Strong Cipher is disabled; PFS is enabled | AES-128-GCM with DH21 |
| Strong Cipher is disabled; PFS is disabled | AES-128-GCM only |
- Upgrade the Controller to version 8.2.0 or later.
- Go to Cloud Fabric > Gateways > Settings > Advanced Security.
- Turn On Strong Cipher Support for Encryption.
- Turn On Perfect Forward Secrecy (PFS) for IPSec.
- Read and understand the warning message, and tick the checkbox to confirm the changes.
- Click Save.
- Go to Cloud Fabric > Gateways > Transit Gateways/Spoke
Gateways.
A table appears with the list of Transit Gateways and Spoke Gateways. - Locate the Transit Gateway or Spoke Gateway to apply AES-256-GCM and PFS on the table and click the Gateway name to open the Gateway Details page.
- Click the Settings tab.
- Turn On Strong Cipher Support for Encryption.
- Turn On Perfect Forward Secrecy (PFS) for IPSec.
- Read and understand the warning message, and tick the checkbox to confirm the changes.
- Click Save. The AES-256-GCM and PFS is applied to the gateway.
Parameter Details
| CoPilot Parameter Name | Description |
|---|---|
| GCP Global VPC Configuration | Settings for global VPC configuration in GCP, including VM tagging method. |
| Virtual Machines Tagging Method | Defines how tags are applied to virtual machines (e.g., Tag on Changes). |
| Rollback on Gateway Creation Error | Enables automatic rollback if gateway creation fails. |
| Global BGP Communities Support | Toggles support for global BGP communities across gateways. |
| Auto Derivation | Enables or disables automatic derivation of BGP settings. |
| Reset Gateway Overrides | Resets any custom gateway overrides to default settings. |
| Alert Thresholds | Configures CPU, memory, and bandwidth thresholds for alerts. |
| Upgrade Mode | Defines upgrade behavior (manual or automatic) for gateways. |
Configure GCP Global VPC
Configure GCP Global VPC
Modify GCP Global VPC Configuration
Modify GCP Global VPC Configuration
- Go to Cloud Fabric > Gateways > Settings.
The Settings page appears with the GCP Global VPC Configuration card. - On the GCP Global VPC Configuration card, click Modify.
- Select the tagging method:
- Tag on Changes: (recommended) Whenever gateway or connection configuration changes, Aviatrix reevaluates tags in your environment, keeps gateways regionally aware of those changes, and verifies that regions can communicate with each other.
- Auto Tag: The Aviatrix Controller monitors virtual machines launched in the VPCs; it automatically adds tags for newly launched virtual machines and removes tags when virtual machines are removed from the VPC.
- Manage Manually: You apply all tagging in the GCP console; Aviatrix becomes regionally aware of those tags.
- Optionally, exclude virtual machines from GCP Global VPC routing by selecting them from the Exclude Virtual Machines dropdown menu.
- Optionally, use the Notify when new Virtual Machines are discovered button to start or stop notifications when new Virtual Machines are discovered and tagged.
- Click Save.
Parameter Details
| CoPilot Parameter Name | Description |
|---|---|
| Virtual Machines Tagging Method | Defines how tags are applied to virtual machines (e.g., Tag on Changes). |
| Exclude Virtual Machines | Exclude specific VMs from GCP Global VPC routing; excluded VMs remain accessible through global routing tables. |
| Notify when new Virtual Machines are discovered | Start or stop notifications when new Virtual Machines are discovered and tagged. |
Reapply GCP Global VPC Tags
Reapply GCP Global VPC Tags
- Go to Cloud Fabric > Gateways > Settings.
The Settings page appears with the GCP Global VPC Configuration card. - On the GCP Global VPC Configuration card, click Reapply Tags. The operation syncs VPC subnets, updates routing tables, and applies tags to new or existing VMs in newly deployed regions.
Enable or Disable Rollback on Gateway Creation Error
Enable or Disable Rollback on Gateway Creation Error
- Go to Cloud Fabric > Gateways > Settings.
The Settings page appears. - In Rollback on Gateway Creation Error, set the toggle to Off.
- Click Save.
Configure Global BGP Communities Support
Configure Global BGP Communities Support
Enable Global BGP Communities Support
Enable Global BGP Communities Support
- Go to Cloud Fabric > Gateways > Settings.
The Settings page appears. - In the Global BGP Communities Support card, click the Global BGP Communities Support toggle to On.
- Click Save.
Enable Auto-Derivation of BGP Communities
Enable Auto-Derivation of BGP Communities
- Go to Cloud Fabric > Gateways > Settings.
The Settings page appears. - In the Global BGP Communities Support card, set Global BGP Communities Support to On.
- Set Auto Derivation to On.
- In Community Prefix, enter the first 16-bit prefix (0–65535) of the BGP community tag format.
- Click Save.
Reset Gateway Overrides
Reset Gateway Overrides
- Go to Cloud Fabric > Gateways > Settings.
The Settings page appears. - Locate the Global BGP Communities Support card.
- Click Reset Gateway Overrides.
- Click Reset to confirm.
Global Smart Gateways
Global Smart Gateways
Enable Global Smart Gateways Support
Enable Global Smart Gateways Support
- Go to Cloud Fabric > Gateways > Settings.
The Settings page appears. - In the Global Smart Gateways Support card, set the toggle to On.
- Click Save.
Enable Underlay Mesh Connectivity
Enable Underlay Mesh Connectivity
- Go to Cloud Fabric > Gateways > Settings.
The Settings page appears. - In the Global Smart Gateways Support card, confirm the toggle is
On.
The card body appears with Underlay Mesh Connectivity, gateway counts, and the Rollout Smart Gateways button. - Set Underlay Mesh Connectivity to On.
- Click Save.
Roll Out Smart Gateways to Specific Gateways
Roll Out Smart Gateways to Specific Gateways
- Go to Cloud Fabric > Gateways > Settings.
The Settings page appears. - In the Global Smart Gateways Support card, click Rollout Smart
Gateways.
The Rollout Smart Gateways dialog appears with a list of gateways that have Underlay Mesh Connectivity enabled. Gateways with Underlay Mesh Connectivity turned off do not appear in this list. - Select or clear the checkbox next to each gateway to enable or disable Smart Gateways for it.
- Click Rollout.
Parameter Details
| CoPilot Parameter Name | Description |
|---|---|
| Name | Name of the gateway. |
| Account | Cloud account the gateway belongs to. |
| Region | Cloud region where the gateway is deployed. |
| Gateway Type | Whether the gateway is a Transit or Spoke Gateway. |
| Cloud Tags | Cloud provider hosting the gateway. |
Disable Global Smart Gateways Support
Disable Global Smart Gateways Support
- Go to Cloud Fabric > Gateways > Settings.
The Settings page appears. - In the Global Smart Gateways Support card, set the toggle to Off.
- Click Save.
- Read the warning message and click Disable to confirm.