> ## Documentation Index
> Fetch the complete documentation index at: https://docs.aviatrix.com/llms.txt
> Use this file to discover all available pages before exploring further.
# Viewing Recent Changes Made to Your Network
> Shortly after a problem occurs in the network, you can use CoPilot to see if recent changes to network constructs may have caused the problem. Using the CoPilot Topology Replay feature, you can pinpoint when changes occurred and analyze the details of changed constructs.
Shortly after a problem occurs in the network, you can use CoPilot to see if
recent changes to network constructs may have caused the problem. Using the
CoPilot Topology Replay feature, you can pinpoint when changes occurred and
analyze the details of changed constructs.
See the **CoPilot > Cloud Fabric > Topology > Replay** page.
## View Topology Changes (Topology Replay)
This section describes how to use the Topology Replay feature of Aviatrix
CoPilot. You use Topology Replay to see what changed in your environment and
when it changed. This feature can be used, for example, shortly after a problem
occurs in the network to see if recent changes to network constructs may have
caused the problem. See also
[Topology Replay Properties](#topology-replay-properties).
Topology Replay shows when route, credential, and other metrics in your cloud
network constructs changed. The changes are shown for all constructs regardless
if they are located in one or multiple clouds. You can view the changes
(additions, modifications, and deletions) that were made to the properties of
subnets, gateways, and gateway connections. A time series visualization graphs
change-set data as points (blue dots) with each change set collected at
one-minute intervals. Clicking on a change set in the time series panel loads it
into the topology map and changes details pane where you can inspect the data.
For more information about UI controls in topology replay, see
[Topology Replay Properties](#topology-replay-properties).
To view topology changes in your environment, use the following steps:
1. In CoPilot, go to **CoPilot > Cloud Fabric > Topology** and then click the
**Replay** tab.
The topology replay page opens showing a topology map, a changes details
pane, and a time series panel.
2. Locate and load the changes you want to inspect:
* (**To locate the most recent changes**) When the page first opens or is
refreshed, the most recent change set is automatically loaded in the
topological map and details pane. In the time series panel, the change set
is shown as a dark blue box that indicates the number of changes within it.
For example, **120 Changes** (this is the default title of the change set).
* (**To locate earlier changes**) By default, in the time series panel,
CoPilot shows changes that occurred within one-minute increments. Each
Expand icon has a number which represents the number of change sets that
exist in that focused time period. Click on an Expand icon to zoom into
that time period.
Alternatively, on the track pad, pinch or stretch out two fingers to quickly
zoom out of or zoom into a time period.
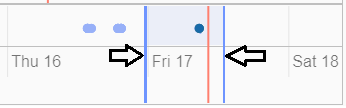
The bottom of the time series visualization shows changes that were recorded
over the last week. There, you can drag the time-window control lines (blue
vertical lines) to encompass a day (or multiple days) to quickly zoom into
change sets for that time period.
Keep zooming into a time period until you see a View icon. The View icon
indicates a change set at that point in time. Click on the View icon to load
the change set. It may take a few seconds to load. After it loads, the View
icon is replaced by a blue box with the title of the change set (the title
reflects the number of changes in the change set). Hovering over the blue box
displays the end time of the change set.
* (**To locate a specific change by title or note**) You can change the
titles of change sets. You can also associate notes with them. To search
for a specific change set based on a previously applied title or note,
click the search icon in the changes details pane, enter any text that is
part of the title or note, and then click Search. Change sets matching the
search criteria are listed. Click on one from the list to load it.
3. **Inspect changes for a loaded change set.**
You inspect changes for a change set in the changes details pane.
When inspecting changes:
* Network constructs are organized by construct type in a tree view. Expand
the tree for each contruct type to drill down to properties of that
construct that were added, modified, or deleted. Changes are shown as green
for additions, orange for modifications, and red for deletions.
* Click on a network construct in the topology map to bring its change
details into focus in the details pane.
* For each selected construct in the changes details pane, select or deselect
the eyeball icon to toggle between showing only changed data for a
construct or showing all data for a construct (to put the changes in
context).
* Click the AUDIT button to open the Audit tab of the Security section where
you can see which users made API calls to Aviatrix Controller during the
time period of the change set.
4. (**To modify the title of a change set**) To modify the title of a change set
that is loaded in the changes details pane, click on the red notepad icon to
open note view. The title is displayed over the dates (the default title is
the number of changes in the change set). Click the blue pen icon. Select the
title and change it, and then click the Save icon. When you search the
timeline for change sets, you can now search by your title text.
5. (**To associate a note with a change set**) To associate a note with a change
set that is loaded in the changes details pane, click on the red notepad icon
to open note view. Click the blue pen icon, type your note, and then click
the Save icon. When you search the timeline for change sets, you can now
search by your note text.
6. (**To delete a change set**) To delete a change set that is loaded, in the
time series panel, click on the red X associated with the dark blue box that
represents it. It will be permanently deleted from the topology-replay
database. You can also choose to delete all previous change sets recorded up
to that point.
### Topology Replay Properties
This section describes properties of the Topology Replay feature in Aviatrix
CoPilot.
#### Topology Replay - Topology Map
The topology map shows network constructs that were changed in the environment
for changes associated with the currently loaded change set.
Properties of the topology map include:
* Show full topology
Click **Show full topology** to see how the changed constructs relate to all
constructs in your Aviatrix managed environment (the full topology is shown at
that point in time).
* Disable physics
Click **Disable physics** if you do not want objects to move on their own and
have them stay in the location you place them (when you click and drag them
there).
* Hide Highlights
Click **Hide highlights** to remove the circles from the objects in the map
that denote they represent changed constructs.
#### Topology Replay - Changes Details Pane
The changes details pane shows all details for the currently loaded change set,
including:
* The name of the change set (reflecting the total number of changes in it).
* The start time and end time for which changes were recorded.
* The number of changes by type that were made to the properties of constructs:
* Additions
* Deletions
* Modifications
* The network constructs that are associated with the changes organized by
construct type in a tree view. Detailed information about what metrics changed
for each construct is shown. For modifications, the old value is shown striked
out near the new value.
Properties of the changes details pane include:
* **AUDIT**
Click the **AUDIT** button to open the Audit tab (of the CoPilot Security
page) where you can view the users that made API calls to Aviatrix Controller
during the time period of the change set.
* **NOTES**
Click the red notepad icon to associate a note with the loaded change set or
to change the change set's title. Click the blue pen icon, then edit the title
or add/edit a note, and then click the Save icon. The title is displayed over
the dates (the default title is the number of Changes in the change set). When
you search the timeline for change sets, you search by your title or note
text.
* **Search**
Use the search to search for change sets by your custom change-set title or
note text (for notes you associated with changes sets).
* **Show only changed data/ Show all changes**
Use the eyeball icon to toggle between showing only changed data for a
construct or showing all data for a construct (to put the changes in context).
This option can be set per construct, per construct type, or globally.
#### Topology Replay - Time Series Panel
The time series visualization graphs change-set data as points (blue dots) with
each change-set collected at one-minute intervals shown in the change timeline
(top half of the panel). The overview timeline in the time series panel (bottom
half of the panel) shows the duration of all replay data (from the first replay
date to the current date). The most recently recorded change set is shown as a
dark blue box labeled with the number of changes in that change set.
Properties of the time series panel include:
* Currently loaded change set
The time series panel highlights the current change set as a dark blue box
labeled with the number of changes the change set contains. Hover over the box
to view the end time of the change set. The green box represents the base of
the currently loaded change set.
* **Expand** controls to zoom into a time period
In the change timeline (top half of the panel) each Expand icon has a number
which represents the number of change sets that exist in that change-set
cluster. On your track pad, pinch or stretch out two fingers to quickly zoom
into or zoom out of a time period to view change sets that occurred within a
more narrow timeframe. You can also zoom into a time period by clicking on the
Expand icons. You can click on and drag the top of the panel backward and
forward to view changes that happened minutes earlier/later.
* Time-window control lines
In the overview timeline (bottom half of the panel), after you zoom into a
time period by clicking on the Expand icons or by using your track pad, two
time-window control lines (blue vertical lines) display near the current time
(the red line). Drag the time-window control lines where needed to focus in on
the day or days you want to locate change sets in.
 * **View** controls to load a change set
The View icon indicates a change set at that point in time. Click on a View
control to load a change set; this populates the network constructs associated
with the changes in the topology map and displays the details for their
changes in the changes details pane. The constructs associated with the
changes are circled in the map.
* **View** controls to load a change set
The View icon indicates a change set at that point in time. Click on a View
control to load a change set; this populates the network constructs associated
with the changes in the topology map and displays the details for their
changes in the changes details pane. The constructs associated with the
changes are circled in the map.