> ## Documentation Index
> Fetch the complete documentation index at: https://docs.aviatrix.com/llms.txt
> Use this file to discover all available pages before exploring further.
# Configure Telemetry Export Profiles
> Create and manage Telemetry Export Profiles to forward Aviatrix telemetry from the Universal OTEL Export pipeline to your external SIEM, observability, or archival systems.
## Overview
Telemetry Export Profiles let you send Aviatrix telemetry to your own
external SIEM, observability, or archival systems. Instead of building a
separate integration for each telemetry type, you configure one or more
**Telemetry Export Profiles**, and each profile controls what telemetry it
forwards, the connection it uses, and where it is sent.
Each profile can forward the following telemetry source types:
* Distributed Cloud Firewall (DCF) security logs
* Gateway infrastructure metrics
Each profile forwards telemetry using one of the following connection types:
* **OTLP over gRPC**, optionally with server TLS
* **OTLP over HTTP**, optionally with TLS
Syslog is not a supported export protocol for Telemetry Export Profiles in
this release.
A Controller supports a maximum of **10 Telemetry Export Profiles**. For the
complete field-level breakdown of each connection type's configuration
options, see Telemetry Export Profile Reference.
## Prerequisites
* Aviatrix Controller running version 10.1 or later.
* CoPilot running version 4.35 or later, deployed and connected to the
Controller.
* Administrator access to CoPilot.
* Network connectivity from Aviatrix Gateways to the destination endpoint
(firewall rules and security groups permitting outbound traffic on the
destination port).
* The destination endpoint (SIEM, observability platform, data lake, or
compliance archive) ready to receive OTLP/gRPC or OTLP/HTTP traffic,
including any required TLS certificates or authentication credentials.
* Fewer than 10 Telemetry Export Profiles already configured on the
Controller.
## Create a Telemetry Export Profile
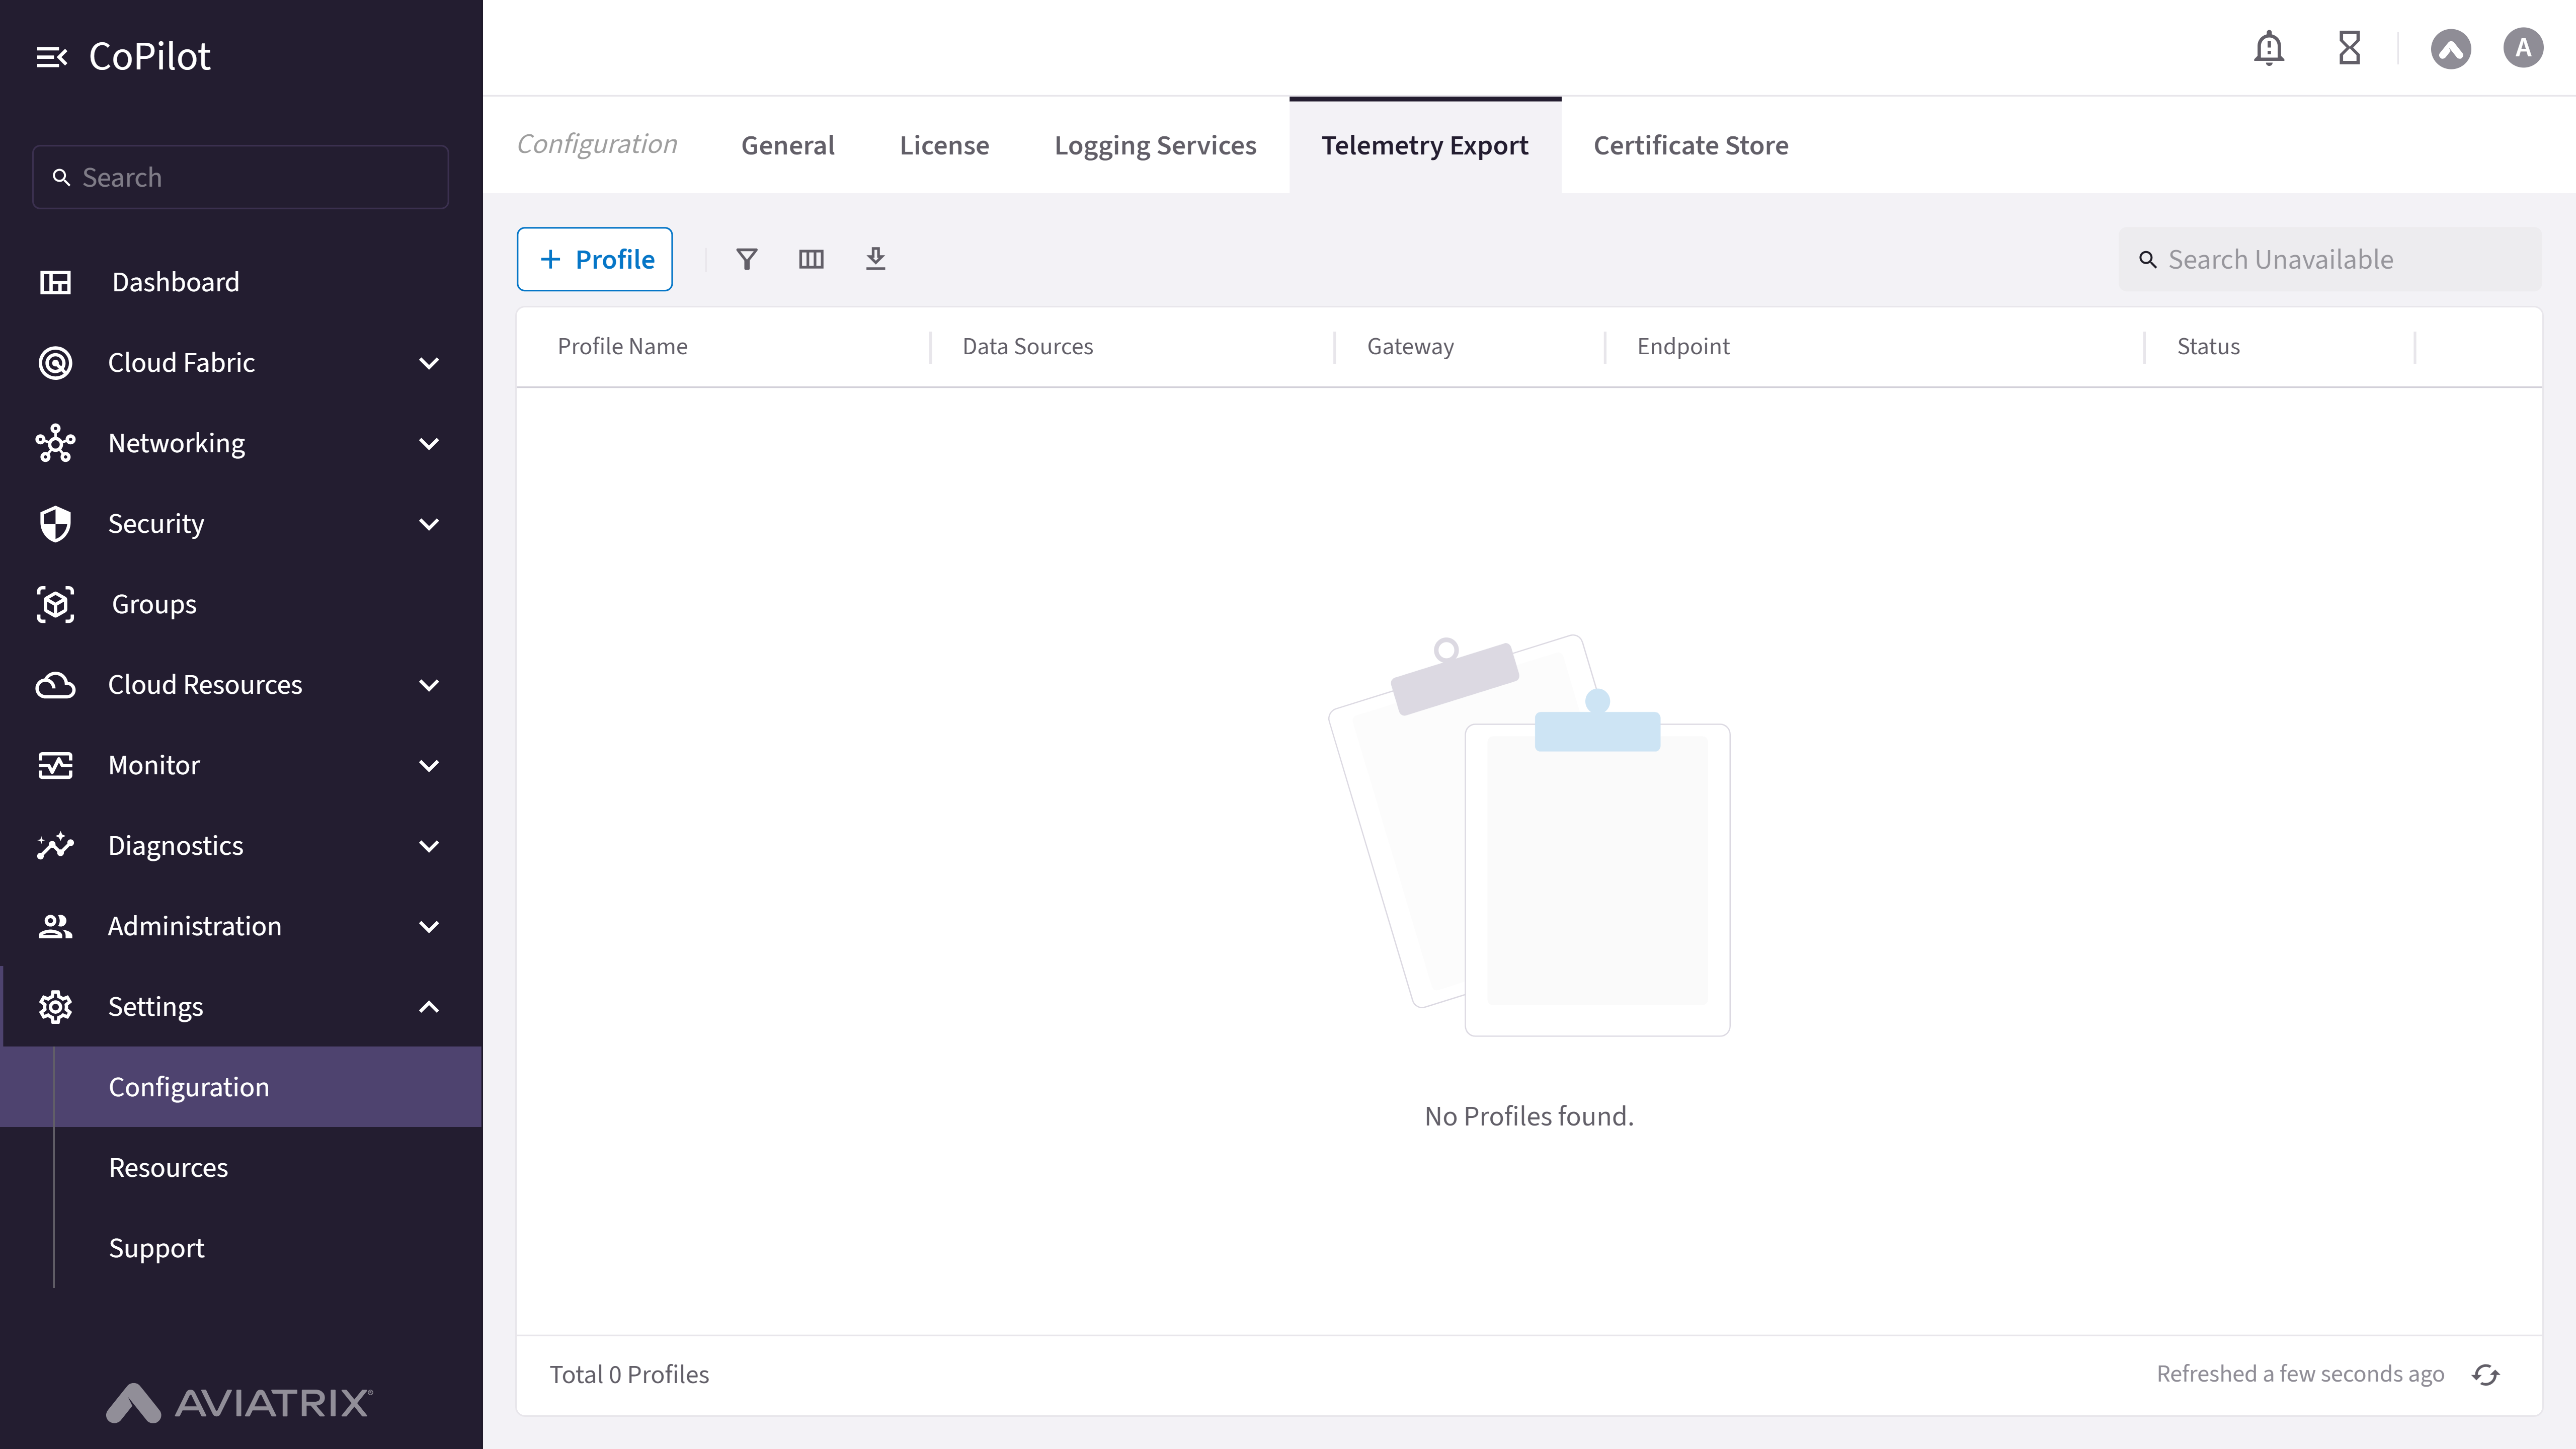 In Aviatrix CoPilot, go to **Settings > Configuration > Telemetry Export**.
Click **+ Profile**.
A Controller allows a maximum of 10 Telemetry Export Profiles. If you
have already reached this limit, delete or consolidate an existing
profile before creating a new one.
Enter a descriptive display name. Use a name that identifies the
destination system and purpose, for example `splunk-dcf-security`.
Select one or more data source cards for the telemetry this profile
forwards:
* **DCF Logs**
* **Gateway Metrics**
Data sources cannot be changed after the profile is created. To
forward a different set of sources, create a new profile.
Choose which gateways this profile applies to:
* **All Gateways**
* **Gateways by Name** — select specific gateways from an autocomplete
list (shows VPC/VNet name and region).
* **Gateway by Conditions** — match gateways dynamically, for example by
region or by a gateway name pattern.
Leave **Forwarding Status** set to **On** so the profile forwards
telemetry once saved, or turn it **Off** to save the profile without
activating it.
On the **Connection** step, select one of the following methods:
| Method | Typical use |
| -------------------- | ----------------------------------------------------------------------------------------- |
| gRPC with Server TLS | The gateway verifies the collector's identity. Default method for an OTLP/gRPC collector. |
| gRPC with Mutual TLS | Both sides verify each other's certificates. Use when your collector requires mTLS. |
| HTTP with TLS | The gateway verifies the collector's identity, delivered over OTLP/HTTP. |
The fields available in the remaining steps depend on the method you
select. See Telemetry Export Profile Reference for the full field list
per method.
Enter the **OTLP Destination URL** for your external system, as a URL or
in `host:port` format.
Optionally select a **CA Certificate** file (PEM format) to validate the
destination. Leave this blank to use the system CA trust store — a
custom CA certificate is only required for destinations using a private
or internal CA.
Optionally add one or more **Custom Headers** (for example, an
`Authorization` header carrying a bearer token, or a vendor-specific API
key header) to authenticate to the destination. Headers are optional —
leave this section empty if your destination does not require them.
Header values added here are not visible again after you save the
profile. Add all required headers before saving — you cannot view an
existing header's value later to confirm or copy it.
Click **Save**.
## Verify That Export Is Flowing
In **Settings > Configuration > Telemetry Export**, confirm the profile
shows a **Status** of **Enabled** in the profile table.
**Status** reflects the profile's **Forwarding Status** toggle
(Enabled/Disabled), not a live connectivity or health check. Confirm
actual data delivery at the destination system itself, as described in
the next step.
In your external system (SIEM, observability platform, data lake, or
compliance archive), confirm that telemetry from the assigned data
sources is arriving as expected.
If telemetry does not appear at the destination, use the profile's
**Edit** action to review the destination, CA certificate, and header
configuration for mistakes.
A dedicated per-profile error or connectivity-status indicator may not
be available. Rely on the destination system's own ingestion logs to
confirm delivery.
## Related Documentation
* Telemetry Export Profile Reference
* Controller and Gateway Logging
* Metrics Monitored for Aviatrix Resources
In Aviatrix CoPilot, go to **Settings > Configuration > Telemetry Export**.
Click **+ Profile**.
A Controller allows a maximum of 10 Telemetry Export Profiles. If you
have already reached this limit, delete or consolidate an existing
profile before creating a new one.
Enter a descriptive display name. Use a name that identifies the
destination system and purpose, for example `splunk-dcf-security`.
Select one or more data source cards for the telemetry this profile
forwards:
* **DCF Logs**
* **Gateway Metrics**
Data sources cannot be changed after the profile is created. To
forward a different set of sources, create a new profile.
Choose which gateways this profile applies to:
* **All Gateways**
* **Gateways by Name** — select specific gateways from an autocomplete
list (shows VPC/VNet name and region).
* **Gateway by Conditions** — match gateways dynamically, for example by
region or by a gateway name pattern.
Leave **Forwarding Status** set to **On** so the profile forwards
telemetry once saved, or turn it **Off** to save the profile without
activating it.
On the **Connection** step, select one of the following methods:
| Method | Typical use |
| -------------------- | ----------------------------------------------------------------------------------------- |
| gRPC with Server TLS | The gateway verifies the collector's identity. Default method for an OTLP/gRPC collector. |
| gRPC with Mutual TLS | Both sides verify each other's certificates. Use when your collector requires mTLS. |
| HTTP with TLS | The gateway verifies the collector's identity, delivered over OTLP/HTTP. |
The fields available in the remaining steps depend on the method you
select. See Telemetry Export Profile Reference for the full field list
per method.
Enter the **OTLP Destination URL** for your external system, as a URL or
in `host:port` format.
Optionally select a **CA Certificate** file (PEM format) to validate the
destination. Leave this blank to use the system CA trust store — a
custom CA certificate is only required for destinations using a private
or internal CA.
Optionally add one or more **Custom Headers** (for example, an
`Authorization` header carrying a bearer token, or a vendor-specific API
key header) to authenticate to the destination. Headers are optional —
leave this section empty if your destination does not require them.
Header values added here are not visible again after you save the
profile. Add all required headers before saving — you cannot view an
existing header's value later to confirm or copy it.
Click **Save**.
## Verify That Export Is Flowing
In **Settings > Configuration > Telemetry Export**, confirm the profile
shows a **Status** of **Enabled** in the profile table.
**Status** reflects the profile's **Forwarding Status** toggle
(Enabled/Disabled), not a live connectivity or health check. Confirm
actual data delivery at the destination system itself, as described in
the next step.
In your external system (SIEM, observability platform, data lake, or
compliance archive), confirm that telemetry from the assigned data
sources is arriving as expected.
If telemetry does not appear at the destination, use the profile's
**Edit** action to review the destination, CA certificate, and header
configuration for mistakes.
A dedicated per-profile error or connectivity-status indicator may not
be available. Rely on the destination system's own ingestion logs to
confirm delivery.
## Related Documentation
* Telemetry Export Profile Reference
* Controller and Gateway Logging
* Metrics Monitored for Aviatrix Resources