> ## Documentation Index
> Fetch the complete documentation index at: https://docs.aviatrix.com/llms.txt
> Use this file to discover all available pages before exploring further.
# Monitoring Business Unit Costs with CostIQ
> This section describes the CostIQ feature of Aviatrix CoPilot.
This section describes the CostIQ feature of Aviatrix CoPilot.
## Enabling CostIQ
This feature is off by default. You can enable CostIQ in CoPilot.
1. Go to **Configuration > Settings > General**.
2. Under **Features**, set CostIQ to **On** and click **Save**.
The CostIQ tab will now be visible under Monitoring in the left navigation.
3. Go to **Monitoring > CostIQ**.
4. Click **Enable CostIQ** in the notification banner at the top of the page and
follow the instructions in the configuration panes to create **Cost Centers**
and **Shared Services**.
## Working with CostIQ
The CostIQ feature gives you visibility into the traffic data of your deployed
networks that are managed by the Aviatrix Controller as they relate to your cost
centers. This traffic data are reported as percentages of traffic generated by
end instances in Spoke VPC/VNets.
The cost information displayed in CostIQ is grouped by:
* Cost Center - A group of resources categorized by associated VPCs/VNets. These
CoPilot Cost Centers contain resources used by your real-life cost centers or
business units.
* Shared Service - A cloud or network resource shared by multiple teams or cost
centers. You define Shared Services by listing the IP addresses or IP CIDR
ranges of the shared resource hosts.
- The CostIQ feature requires that your Controller use software version **6.8 or
later**.
- The VPC/VNets defined in each cost center are typically mutually exclusive.
You can include the same VPC/VNet in multiple cost centers, but doing so can
skew cost-reporting results.
You access CostIQ in CoPilot by going to **Monitor > CostIQ** or typing
**CostIQ** in the navigation search.
### Overview of CostIQ
The CostIQ Overview tab shows cost information about Aviatrix-managed resources
across your entire multicloud network. The charts and tables included show the
traffic of your Cost Centers and Shared Services.
Use the Time Period options at the top of the page to adjust the time period for
these data visualizations.
| Chart or Graph | Description |
| ----------------------------- | ----------------------------------------------------------------------------------------------------------------------------------------------------------------------------------------------------------------------------------------------------------------------------------------------------------------------------------------------------------------------- |
| Top Cost Centers | Top Cost Centers lists the Cost Centers in your network with the highest costs. The percentage on the right shows each Cost Center's expenditure as a percentage of total network costs. |
| Top Shared Services | Top Shared Services lists the Shared Services in your network with the highest costs. The percentage on the right shows each Shared Service's expenditure as a percentage of total network costs. |
| Cost Center Traffic Trends | This graph shows traffic trends for each Cost Center in your network. Each Cost center is represented as a colored line on the graph. Each data point in each line represents one Cost Center's percentage of traffic out of the total traffic for all Shared Services. Use this graph to review increases or decreases in the traffic of each Cost Center. |
| Shared Service Traffic Trends | This graph shows traffic trends for each Shared Service in your network. Each Shared Service is represented as a colored line on the graph. Each data point in each line represents one Shared Service's percentage of traffic out of the total traffic for all Shared Services. Use this graph to review increases or decreases in the traffic of each Shared Service. |
### Cost Centers in CostIQ
The Cost Centers tab lists the Cost Centers you have created, the Cloud Tags
that contain the Cost Center resources, and the percentage of total traffic for
which each Cost Center is responsible.
Select a Cost Center to drill down on its information. A panel opens on the
right to show more data.
Use the Time Period options at the top of the panel to adjust the time period
for these data visualizations.
The table below describes the type of data displayed for each instance in the
Cost Center:
| Column | Description |
| ------------- | --------------------------------------------------------------------------------- |
| Resource Name | The name of this instance. |
| Rel. Traffic | The percentage of this instance's traffic out of the total Cost Center traffic. |
| Abs. Traffic | The percentage of this instance's traffic out of the total Cost Center's traffic. |
| Traffic | The absolute value of this instance's traffic. |
For some VPCs and VNets in this panel, you can select a filter icon next to the
VPC or VNet name to the drill down on the Spoke Gateways it includes. The
following table describes the type of data displayed:
| Column | Description |
| ------------ | -------------------------------------------------------------------------------- |
| Gateway | The gateway in this VPC or VNet. |
| Rel. Traffic | The percentage of this gateway's traffic out of the total VPC or VNet traffic. |
| Abs. Traffic | The percentage of this gateway's traffic out of the total Cost Center's traffic. |
| Traffic | The absolute value of this VPC or VNet's traffic. |
### Adding a New Cost Center
To add a new Cost Center, go to **Monitor > CostIQ > Cost Centers**.
#### Adding New Cost Centers
1. On the Cost Centers tab, click **+ Cost Center**.
2. Name the Cost Center.
* You can use the following values for Cost Center names: alphanumeric
characters, whitespace, hyphens, and underscores.
* The maximum length of a name is 128 characters.
* Special characters are not allowed.
3. Select the **Spoke VPC/VNets** to comprise this Cost Center.
#### Selecting Spoke VPC/VNets
To add resources to a Cost Center by selecting Spoke VPC/VNets, click on the
Associate VPCs dropdown menu and select the necessary VPC/VNets.
Note that these VPCs or VNets should be the ones used by your real-life cost
centers. The VPC/VNets defined in each cost center are typically mutually
exclusive. You can include the same VPC/VNet in multiple cost centers, but doing
so can skew cost-reporting results. For example, if you define 2 cost centers
with VPC/VNets that overlap, the shared services report will show them both as
consumers of the shared service.
After selecting which resources to include in this Cost Center, click **Save**.
The new Cost Center appears in the table.
### Editing Cost Centers
To edit a Cost Center, in the panel on the right, click the Edit icon. You can
rename the Cost Centers or add and remove the resources included.
### Deleting Cost Centers
1. To delete a Cost Center, in the panel on the right, click the Delete icon.
2. Click **Confirm**.
Deleting a Cost Center does not affect the VPCs/VNets it includes or any data;
it only removes the Cost Center as a way of organizing and visualizing
historical traffic data for your network.
## Shared Services in CostIQ
The Shared Services page displays cost data for your Shared Services, or
networking resources used by multiple teams or departments in your network.
Shared Services are organized by the IP addresses of the resources hosts.
For example, a Shared Service could be an AWS Direct Connect connection that
multiple teams use. The Shared Services view displays what percent of the
connection's total traffic each team is responsible for.
You can break down or organize the Shared Services drilldown by:
* Cost Center - Select this view to see the traffic to the Shared Services for
each Cost Center in your network.
* Cloud Account - Select this view to see the traffic organized by each
individual Cloud Account in your network (in AWS, Azure, GCP, or OCI).
Select a Cost Center to drill down on its information. A panel opens on the
right to show data for each VPC and VNet in this Cost Center.
Use the Time Period options at the top of the page to adjust the time period of
for these data visualizations.
Use the **Amount for Time Period** field to enter the amount of your bill for
the specified time period. CoPilot creates a data visualization of the cost of
this shared service for each resource defined in the cost center.
The table below shows data for each Cost Center or Cloud Account, depending on
how you filtered the Breakdown of the data, by Cost Center or Cloud Account:
| Column | Description |
| ---------------------------- | ------------------------------------------------------------------------------------------------------------------------------- |
| Cost Center or Cloud Account | The Cost Center or Cloud Account in this Shared Service. |
| Cloud | The Cost Center or Cloud Account's region. |
| Rel. Traffic | The percentage of this Cost Center or Cloud Account's traffic to the Shared Shared Service out of total Shared Service traffic. |
| Traffic | The absolute value of this Cost Center or Cloud Account's traffic. |
Select a Cost Center or Cloud Account in this panel to drill down further to the
VPC/VNets it includes:
| Column | Description |
| ------------ | ------------------------------------------------------------------------------------------------------------------------------------------------- |
| VPC/VNet | Each VPC/VNet in this Shared Service. |
| Rel. Traffic | The percentage of this VPC or VNet's traffic to the Shared Service out of the total Cost Center or Cloud Account's traffic to the Shared Service. |
| Abs. Traffic | The percentage of this VPC or VNet's traffic to the Shared Service out of the Shared Service's traffic. |
| Traffic | The absolute value of this VPC/VNet's traffic. |
Select a VPC or VNet in this panel to drill down further to the gateways it
includes:
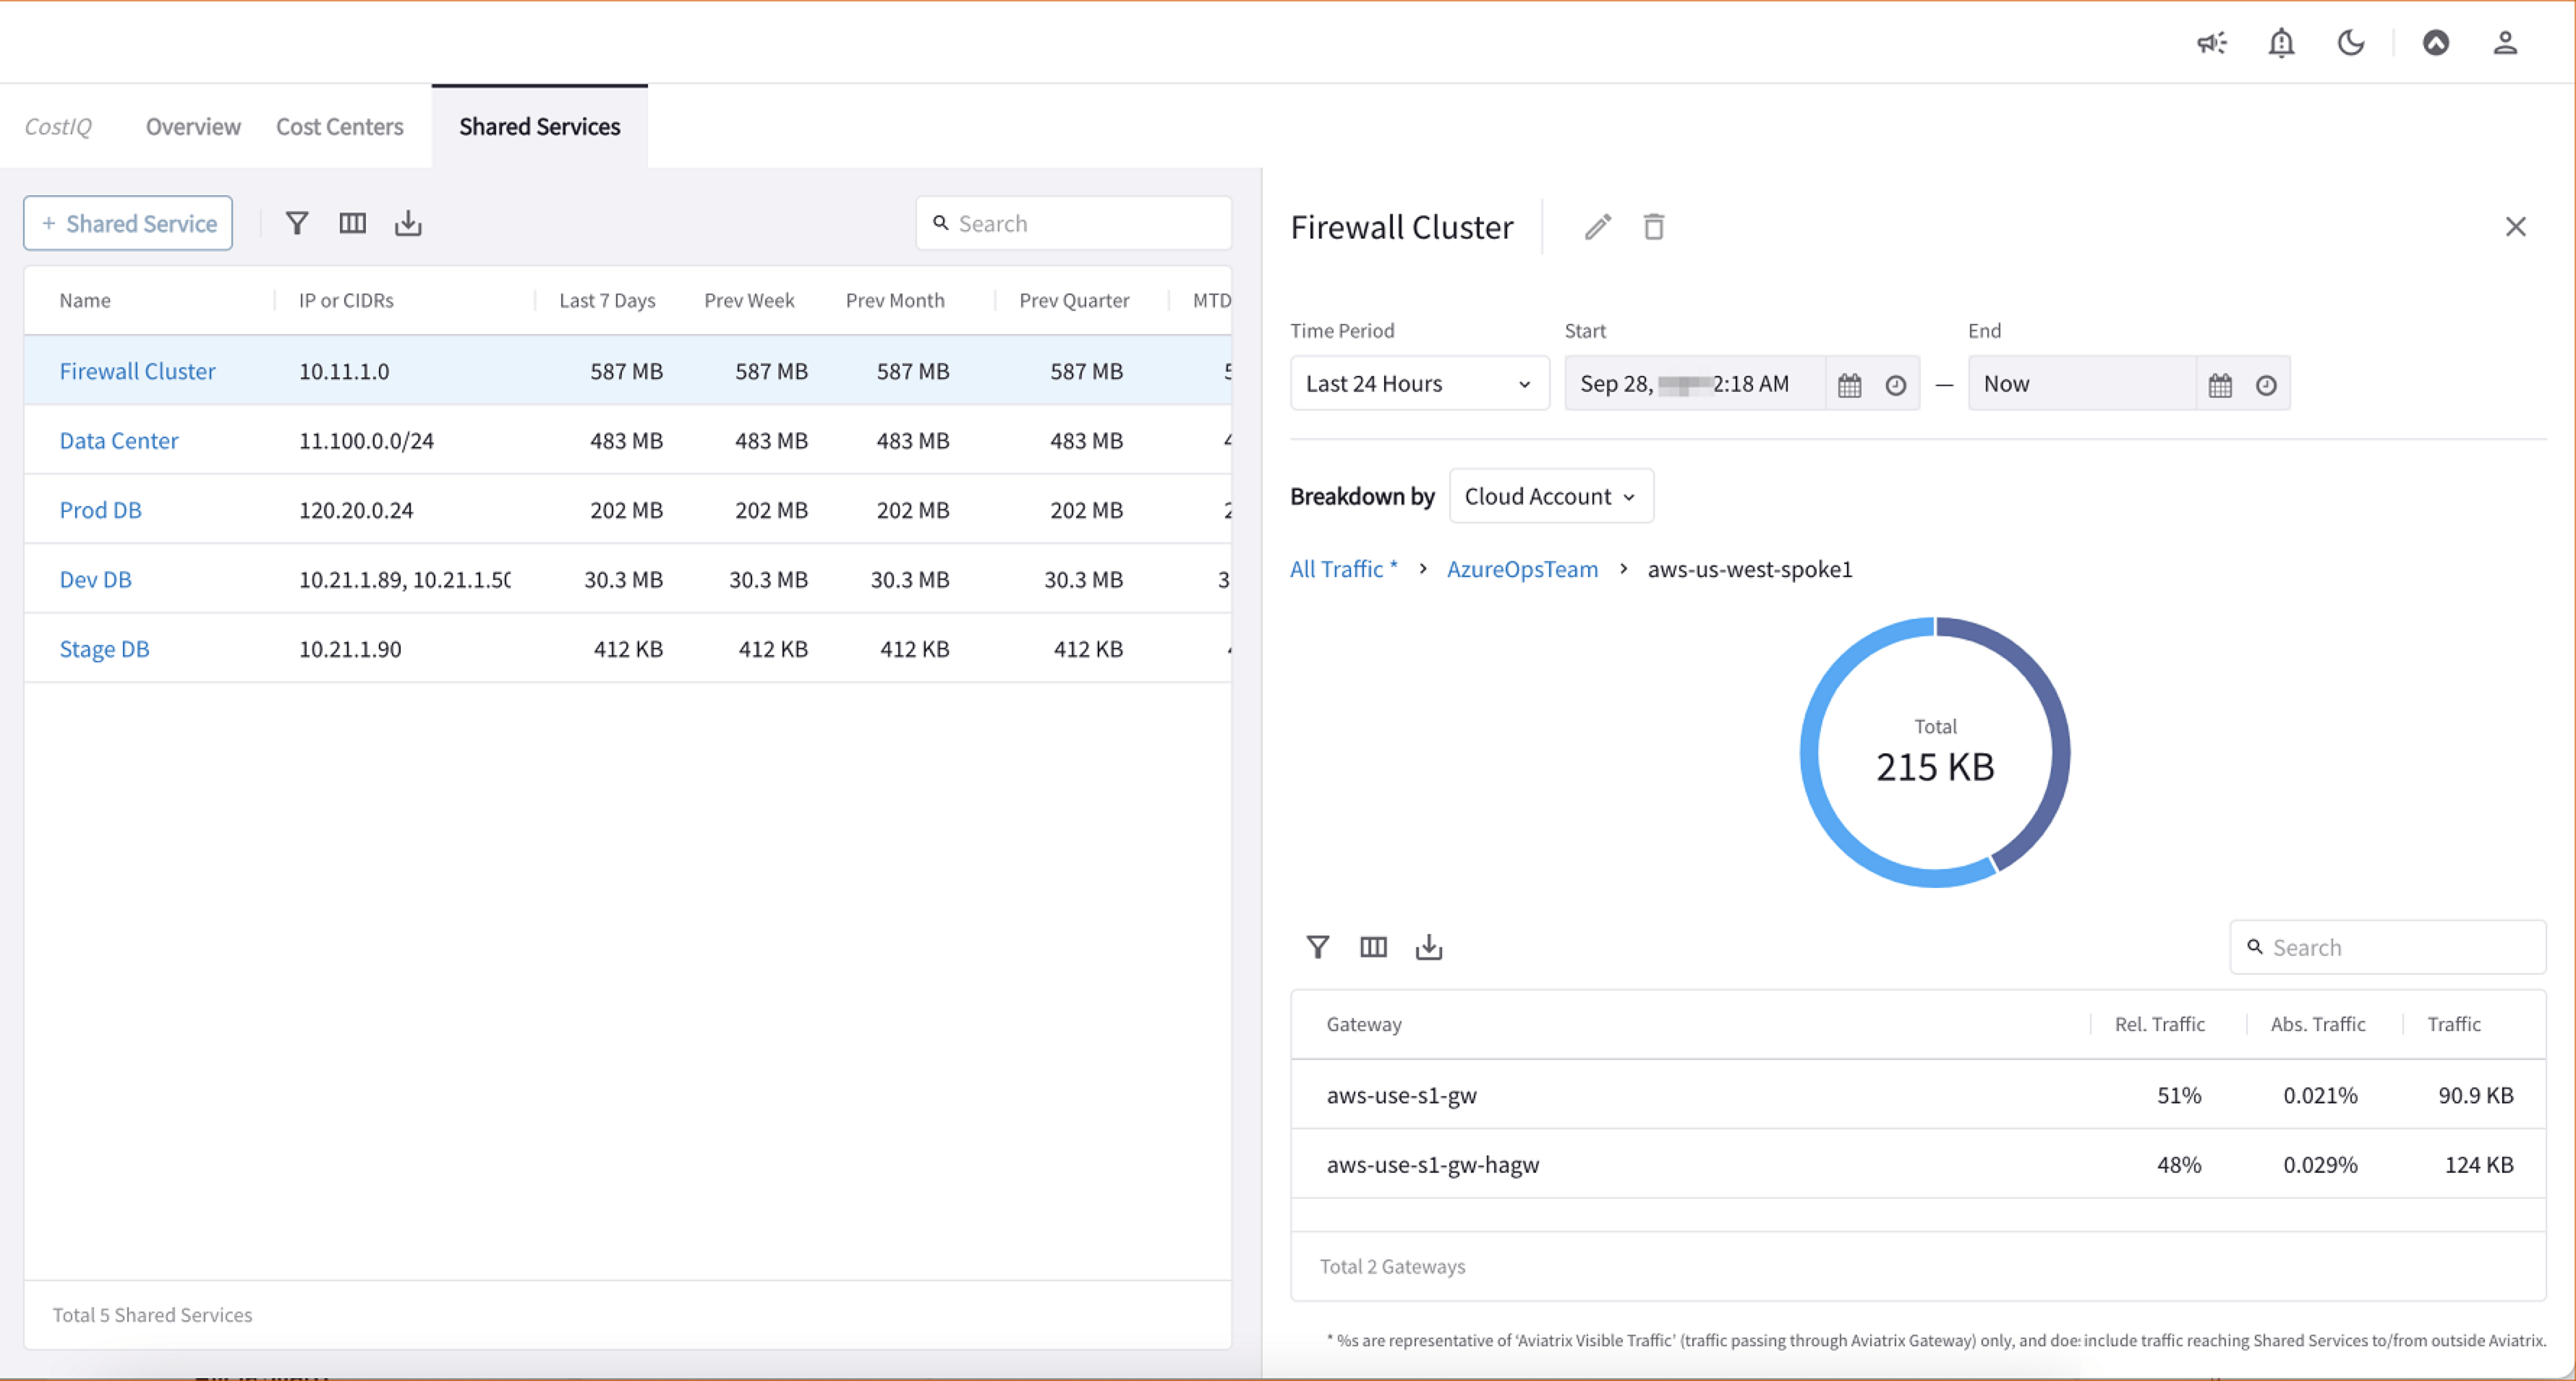 | Column | Description |
| ------------ | ----------------------------------------------------------------------------------------------------------- |
| Gateway | Each gateway in this VPC or VNet. |
| Rel. Traffic | The percentage of gateway traffic to the Shared Service out of the total VPC traffic to the Shared Service. |
| Abs. Traffic | The percentage of this gateway's traffic to the shared Service out of the total Shared Service traffic. |
| Traffic | The absolute value of this gateway's traffic. |
### Adding Shared Services
To add a new Shared Service, click **+ Shared Service** near the top left.
1. Name the Shared Service.
* You can use the following values for Shared Service names: alphanumeric
characters, whitespace, hyphens, and underscores.
* The maximum length of a name is 128 characters.
* Special characters are not allowed.
2. Add the individual IP addresses or IP CIDR ranges to include in the Shared
Service.
3. Click **Save**.
### Editing Shared Services
To edit a Shared Service, in the panel on the right, click the Edit icon. You
can rename the Shared Services or add and remove the IP CIDR ranges it includes.
### Deleting Shared Services
1. To delete a Shared Service, in the panel on the right, click the Delete icon.
2. Click **Confirm**.
Deleting a Shared Service does not affect the IP addresses or CIDRs it includes
or any data; it only removes the Shared Service as a way of organizing and
visualizing historical cost data for your network.
| Column | Description |
| ------------ | ----------------------------------------------------------------------------------------------------------- |
| Gateway | Each gateway in this VPC or VNet. |
| Rel. Traffic | The percentage of gateway traffic to the Shared Service out of the total VPC traffic to the Shared Service. |
| Abs. Traffic | The percentage of this gateway's traffic to the shared Service out of the total Shared Service traffic. |
| Traffic | The absolute value of this gateway's traffic. |
### Adding Shared Services
To add a new Shared Service, click **+ Shared Service** near the top left.
1. Name the Shared Service.
* You can use the following values for Shared Service names: alphanumeric
characters, whitespace, hyphens, and underscores.
* The maximum length of a name is 128 characters.
* Special characters are not allowed.
2. Add the individual IP addresses or IP CIDR ranges to include in the Shared
Service.
3. Click **Save**.
### Editing Shared Services
To edit a Shared Service, in the panel on the right, click the Edit icon. You
can rename the Shared Services or add and remove the IP CIDR ranges it includes.
### Deleting Shared Services
1. To delete a Shared Service, in the panel on the right, click the Delete icon.
2. Click **Confirm**.
Deleting a Shared Service does not affect the IP addresses or CIDRs it includes
or any data; it only removes the Shared Service as a way of organizing and
visualizing historical cost data for your network.