> ## Documentation Index
> Fetch the complete documentation index at: https://docs.aviatrix.com/llms.txt
> Use this file to discover all available pages before exploring further.
# Controller and Gateway Logging
> The Aviatrix Controller and all of its managed gateways can be configured to forward their logs to well known log management systems. The Controller and all the managed gateways will forward the logs directly to the logging server.
## Overview of Controller and Gateway Logging
The Aviatrix Controller and all of its managed gateways can be configured to
forward their logs to well known log management systems. The Controller and all
the managed gateways will forward the logs directly to the logging server. As
such, the Controller and each managed gateway needs network connectivity to the
logging server.
Aviatrix supports using Remote Syslog (rsyslog) for forwarding log messages.
Remote Syslog as the log forwarder is both efficient and the industry standard.
Most log collectors support rsyslog as a log forwarder.
Log data collected from Aviatrix Controller and all the managed gateways can be
forwarded by Remote Syslog to your log server, such as to:
* Datadog
* NetFlow
* AWS CloudWatch
See
[Aviatrix Logging Copilot](https://legacy.docs.aviatrix.com/documentation/latest/platform-administration/copilot/aviatrix-logging-copilot.html)
for information about configuring the log server agents with CoPilot.
In addition to standard information on syslog, Aviatrix logs also provide
informational insights into UserVPN connections, VPN user TCP sessions, security
rule violation statistics, gateway stats and FQDN filter violations.
The chosen log management system can sift through the Aviatrix logs to get
meaningful trend charts that can help monitor the network connectivity and
UserVPN sessions. See [Aviatrix Log Formats](#aviatrix-log-formats) for a list
of useful Aviatrix logs which can be parsed on the log management system to
display relevant analytics of data collected from Aviatrix Controller and
gateways.
The process the Gateways and Controller use for exporting their log files is as
follows:
The process the Gateways and Controller use for exporting their log files is
different in Controller software versions earlier than 7.0.1726. In addition,
the log file prefix previously included the log filename and log timestamp.
For details, see Field Notice 42.
Aviatrix gateways and Controller stream the log lines being written to the
*syslog* and *auth.log* files. When you use the default rsyslog server
configuration suggested in
[Aviatrix Documentation](#remote-syslog-configuration-on-controller), the logs
streamed from the Controller and gateways have multiple files. Each file is
named with the application that generated the log. For example, all logs
generated by the *avx-gw-state-sync* application are re-directed to a file named
*avx-gw-state-sync* " on the log server.
The log format is shown below. Your syslog collectors and any related automation
for ingesting logs must accept the log format.
```
Format: [Timestamp] GW-[Name of Gateway]-[Public IP of Gateway] [Name of Application generating log][Application Process ID]: [Log message]
```
*Example of log format:*
```
Mar 23 19:17:50 GW-UdpGateway-50.17.41.173 avx-gw-state-sync[11249]: warn#011gateway_launcher/gateway_launcher.go:212#011daemon exited
```
```
Prefix of log: [Timestamp] GW-[Name of Gateway]-[Public IP of Gateway]
```
```
Example prefix: Mar 23 19:17:50 GW-gg-aws-usw2-s127-35.162.124.66
```
## Configuring Aviatrix to Send Logs to Your Log Server
For information about configuring Aviatrix Controller and its managed gateways
to send logs to your log server, see the following topics:
* [Enabling Aviatrix Controller Logging](#enabling-aviatrix-controller-logging)
* [Remote Syslog Configuration on Controller](#remote-syslog-configuration-on-controller)
* [Remote Syslog Configuration on the Remote syslog Server](#remote-syslog-configuration-on-the-remote-syslog-server)
* [Using Rsyslog with Datadog](#using-rsyslog-with-datadog)
## Enabling Aviatrix Controller Logging
To enable logging at the Aviatrix Controller, go to *Controller > Settings >
Logging* page. After setting the logging configuration in this page, you must
click *Enable* for the configuration to be saved. After logging is enabled, both
the Controller and all gateways will forward logs directly to the logging
server.
A total of 10 profiles from index 0 to 9 are supported for remote syslog, while index 9 is reserved for CoPilot.
Newly deployed gateways will be added to a profile if it is the only profile
enabled in the index range of 0 to 8,
If more than one profile is enabled in the range of 0 to 8, the newly deployed
gateway will not be added to any profile in the range of 0 to 8. You can use the
advanced options in the logging "Edit Options" window to edit the exclude and
include list.
Newly deployed gateways will always be added to profile 9 which is reserved for
CoPilot to monitor.
## Remote Syslog Configuration on Controller
On the Aviatrix Controller, go to *Controller > Settings > Logging > Remote
Syslog* tile:
1. In Profile Index, select a profile to edit and then click the Status button
to expand the configuration pane.
2. Profile Name: The name of this profile.
3. Server: FQDN or IP address of the remote syslog server
4. Port: Listening port of the remote syslog server. By default, it is 6514.
5. Server CA Certificate: Certificate Authority (CA) certificate
6. Client Certificate: Client certificate signed by the same CA
7. Client Private Key: Private key of the client that pairs with the public
certificate
8. Protocol: TCP or UDP (TCP by default)
9. Optional Custom Template: Useful when forwarding to 3rd party servers like
Datadog (Details below)
10. Click *ENABLE*.
## Remote Syslog Configuration on the Remote syslog Server
On the Remote syslog server:
1. Install rsyslog and rsyslog-gnutls packages
2. Create a new config file in /etc/rsyslog.d with similar content as shown
below depending on your rsyslog version to enable the tls connection. Please
make sure key paths are readable by the syslog user.
3. Make sure the output directory /var/log is writable by rsyslog user/daemon.
4. Restart rsyslog service and check port is listening and that there are no
errors in /var/log/syslog.
5. Confirm the port is allowed in the security group / fireware for incoming
traffic.
```bash theme={null}
$ModLoad imtcp
$InputTCPServerRun 514
$DefaultNetstreamDriver gtls
#Certificate location
$DefaultNetstreamDriverCAFile /etc/cert/rsyslog-ca.pem
$DefaultNetstreamDriverCertFile /etc/cert/rsyslog-crt.pem
$DefaultNetstreamDriverKeyFile /etc/cert/rsyslog-key.pem
$InputTCPServerStreamDriverAuthMode x509/certvalid
$InputTCPServerStreamDriverMode 1 # run driver in TLS-only mode
# Re-direct logs to host specific directories
$template TmplMsg, "/var/log/aviatrix/%HOSTNAME%/%PROGRAMNAME%"
*.info,mail.none,authpriv.*,cron.none ?TmplMsg
& ~
```
(version >=8) :
```bash theme={null}
global(
DefaultNetstreamDriver="gtls"
DefaultNetstreamDriverCAFile="/etc/cert/rsyslog-ca.pem"
DefaultNetstreamDriverCertFile="/etc/cert/rsyslog-crt.pem"
DefaultNetstreamDriverKeyFile="/etc/cert/rsyslog-key.pem"
)
template(name="TmplMsg" type="list") {
constant(value="/var/log/aviatrix/")
property(name="hostname")
constant(value="/")
property(name="programname" SecurePath="replace")
constant(value="")
}
ruleset(name="remote"){
*.info;mail.none;authpriv.*;cron.none action(type="omfile" DynaFile="TmplMsg")
}
module(
load="imtcp"
StreamDriver.Name="gtls"
StreamDriver.Mode="1"
StreamDriver.Authmode="anon"
)
input(type="imtcp" port="514" ruleset="remote")
```
Then
1. Go to /var/log/aviatrix directory.
2. Find the directory of the desired Controller or gateway:
* Controller's directory name is in a format of
`Controller-public_IP_of_controller`
* Gateway's directory name is in a format of
`GW-gateway_name-public_IP_of_gateway`
3. Each controller/gateway directory should have:
* auth.log
* syslog
## Format for CA Certificates from External Logging Servers
The Aviatrix Controller expects certificates in PEM format. Convert any
certificates downloaded from your external logging server's documentation into
PEM format. Attempting to upload the wrong format may return an Exception Error.
## Using Rsyslog with Datadog
Go to Controller/Settings/Logging/Remote Syslog and enable the service.
1. Server: intake.logs.datadoghq.com
2. Port: 10514
3. Protocol: TCP
4. For Optional Custom Template, copy the following string and replace the
string DATADOG\_API\_KEY with your own key.
```
DATADOG_API_KEY <%pri%>%protocol-version% %timestamp:::date-rfc3339% %HOSTNAME% %app-name% - - - %msg%\\n
```
## Aviatrix Log Formats
The Aviatrix Controller and all of its managed gateways can be configured to
forward their logs to well known log management systems. This section describes
Aviatrix log keywords that can be identified by log management systems for
further analysis.
### Aviatrix Log Keywords
The following types of Aviatrix log keywords can be identified by the Log
Management System for further analysis:
* AviatrixVPNSession
* AviatrixUser
* AviatrixLicenseVPNUsers
* AviatrixRule
* AviatrixGwMicroSegPacket
* AviatrixGwNetStats
* AviatrixGwSysStats
* AviatrixFQDNRule
* AviatrixTunnelStatusChange
* AviatrixCMD
* AviatrixBGPOverlapCIDR
* AviatrixBGPRouteLimitThreshold
* AviatrixGuardDuty
* AviatrixFireNet
* AviatrixVPNVersion
* AviatrixGatewayStatusChanged
#### AviatrixVPNSession:
This log is for gateways that have VPN enabled. Logs with this prefix come from
the Controller and contain information such as the VPN username, the VPN gateway
IP address and name where the user connects to, client virtual IP address,
connection duration, total received bytes, total transmitted bytes, and login
and logout time. Two logs will be generated for each VPN connection. One is when
the connection is established, the other when it is disconnected.
Example logs:
Connect Log:
```
Aug 17 22:07:39 ip-172-31-46-24 cloudx_cli: AviatrixVPNSession:
User=demo, Status=active, Gateway=demo, GatewayIP=52.52.76.149,
VPNVirtualIP=192.168.0.6, PublicIP=N/A, Login=2016-08-17 22:07:38, Logout=N/A,
Duration=N/A, RXbytes=N/A, TXbytes=N/A
```
Disconnect log:
```
Aug 17 22:26:37 ip-172-31-46-24 cloudx_cli: AviatrixVPNSession:
User=demo, Status=disconnected, Gateway=demo,
GatewayIP=52.52.76.149, VPNVirtualIP=192.168.0.6, PublicIP=N/A,
Login=2016-08-17 22:07:38, Logout=2016-08-17 22:26:37, Duration=0:0:18:59,
RXbytes=2.1 MB, TXbytes=9.03 MB
```
#### AviatrixUser:
This log is for gateways that have VPN enabled. Logs with this prefix come from
each VPN gateway managed by the Controller. The log contains the information for
the TCP session, such as inbound and outbound interface, source IP address,
destination IP address, TTL value, protocol name, and packet length. The log
record is for each packet that passes through the VPN connection from the client
to the destination.
Two example logs:
```
Aug 17 22:15:47 ip-10-100-0-60 kernel: [14167.983249]
***AviatrixUser***:IN= OUT=eth0 SRC=192.168.0.6 DST=68.67.154.85 LEN=64
TOS=0x00 PREC=0x00 TTL=63 ID=28916 DF PROTO=TCP SPT=50428 DPT=443
WINDOW=65535 RES=0x00 SYN URGP=0
Aug 17 22:15:47 ip-10-100-0-60 kernel: [14167.968275]
***AviatrixUser***:IN= OUT=eth0 SRC=192.168.0.6 DST=10.100.0.2 LEN=66
TOS=0x00 PREC=0x00 TTL=254 ID=13309 PROTO=UDP SPT=64775 DPT=53 LEN=46
```
#### AviatrixLicenseVPNUsers:
This log is for gateways that have VPN enabled. Logs with this prefix come from
the Controller and can be used to monitor the license usage of active vpn users
connected to all vpn gateways.
One example log:
```
Sep 25 23:40:19 ip-10-40-0-133 cloudxd: AviatrixLicsenseVPNUsers: users=2
```
There is a typo in some versions (as noted in the above example) that
incorrectly shows this entry as `AviatrixLicsenseVPNUsers` instead of
`AviatrixLicenseVPNUsers`.
#### AviatrixRule:
You need to configure security policies to see AviatrixRule log.
Logs with this prefix come from each gateway managed by the Controller. Any
packet that triggers the security policy rule will generate a log record of this
type with the first 100 bytes of the packet. It contains the information such as
gateway IP address, inbound and outbound interface, MAC address, TTL value,
protocol name, source IP address, destination IP address and packet length.
An example for a deny rule event is shown below. The log event prefix is "AvxRl
gw1 D:", where the gateway name is gw1, "D" represents Drop.
```
2019-04-10T23:33:47.217018+00:00 ip-10-240-0-44 kernel: [ 4976.320353] AvxRl gw1 D:IN=eth0 OUT=eth0 MAC=02:bd:e5:4f:d0:e2:02:d8:14:81:fc:48:08:00 SRC=10.240.1.60 DST=10.230.1.23 LEN=84 TOS=0x00 PREC=0x00 TTL=63 ID=45312 DF PROTO=ICMP TYPE=8 CODE=0 ID=2833 SEQ=1
```
Another example for an accept rule event is shown below. The log event prefix is
"AvxRl StatefulGW2 A:", where the gateway name is StatefulGW2, "A" represents
Accept.
```
2019-04-10T23:34:47.602166+00:00 ip-10-240-0-44 kernel: [ 5036.705845] AvxRl StatfulGW2 A:IN=eth0 OUT=eth0 MAC=02:bd:e5:4f:d0:e2:02:d8:14:81:fc:48:08:00 SRC=10.240.1.60 DST=10.230.1.23 LEN=84 TOS=0x00 PREC=0x00 TTL=63 ID=48453 DF PROTO=ICMP TYPE=8 CODE=0 ID=2834 SEQ=1
```
#### AviatrixGwMicroSegPacket:
You need to configure Distributed Firewalling micro-segmentation
policies to see AviatrixGwMicrosegPacket logs.
Logs with this prefix come from your configured Distributed Firewalling
micro-segmentation policies. These logs contain the following information:
* timestamp
* source IP
* destination IP
* protocol (for example, ICMP or TCP)
* port number
* if a policy is enforced
* if a policy was allowed or denied
* gateway name
* policy ID
A micro-segmentation log example is shown below:
```
2022-05-25T15:57:43.088860+00:00 ip-10-4-179-71 /usr/local/bin/avx-gw-state-sync[1168]: 2022/05/25 15:57:43 AviatrixGwMicrosegPacket:
POLICY=54ea65c4-313e-4b3d-8db3-1ecc4f0981db SRC_MAC=16:06:11:d7:a1:11 DST_MAC=16:54:ec:50:09:17 IP_SZ=84 SRC_IP=10.4.187.253 DST_IP=10.5.144.38
PROTO=ICMP SRC_PORT=0 DST_PORT=0 DATA=0x ACT=PERMIT ENFORCED=true
```
#### AviatrixGwNetStats:
Logs with this prefix come from each gateway managed by the Controller. These
logs are sampled every minute and give details about gateway network interface.
Two example logs:
```
2020-06-09T17:29:31.372628+00:00 GW-test-10.23.183.116 perfmon.py: AviatrixGwNetStats:
timestamp=2020-06-09T17:29:31.371791 name=test public_ip=10.23.183.116.fifo private_ip=172.31.78.160
interface=eth0 total_rx_rate=10.06Kb total_tx_rate=12.77Kb total_rx_tx_rate=2.85Kb
total_rx_cum=207.16MB total_tx_cum=1.2MB total_rx_tx_cum=208.36
2020-06-12T08:30:09.297478+00:00 GW-test-10.23.183.116 perfmon.py: AviatrixGwNetStats:
timestamp=2020-06-12T08:30:09.296752 name=test public_ip=10.23.183.116.fifo private_ip=172.31.78.160
interface=eth0 total_rx_rate=8.84Kb total_tx_rate=8.45Kb total_rx_tx_rate=17.29Kb
total_rx_cum=4.63MB total_tx_cum=6.8MB total_rx_tx_cum=11.44MB
```
#### AviatrixGwSysStats:
Logs with this prefix come from each gateway managed by the Controller. These
logs are sampled every minute and give details about gateway memory, cpu and
disk load.
Two example logs:
```
2020-06-09T17:29:31.372822+00:00 GW-test-10.23.183.116 perfmon.py: AviatrixGwSysStats:
timestamp=2020-06-09T17:29:31.371791 name=test cpu_idle=68
memory_free=414640 memory_available=1222000 memory_total=1871644
disk_total=16197524 disk_free=10982084
2020-06-12T08:22:09.295660+00:00 GW-test-10.23.183.116 perfmon.py: AviatrixGwSysStats:
timestamp=2020-06-12T08:22:09.294333 name=test cpu_idle=99
memory_free=919904 memory_available=1264792 memory_total=1871644
disk_total=16197524 disk_free=11409716
```
#### AviatrixFQDNRule
You need to configure FQDN allow lists in
order to see these logs.
Logs with this prefix come from each gateway managed by the Controller. Domain
name filtering can be configured per gateway via Controller. And every time a
gateway tries to access a domain name, it will check if the domain name passes
the configured filters. If it does, access will be allowed with the state as
MATCHED, otherwise it will be discarded with state as NO\_MATCH.
Two example logs:
```
2019-12-12T04:33:46.892381+00:00 ip-172-32-0-6 avx-nfq: AviatrixFQDNRule2[CRIT]nfq_ssl_handle_client_hello() L#281 Gateway=spoke1-fqdn S_IP=172.32.1.144 D_IP=52.218.234.41 hostname=aviatrix-download.s3-us-west-2.amazonaws.com state=MATCHED Rule=*.amazonaws.com;1
2019-12-12T04:36:53.173210+00:00 ip-172-32-0-6 avx-nfq: AviatrixFQDNRule1[CRIT]nfq_ssl_handle_client_hello() L#281 Gateway=spoke1-fqdn S_IP=172.32.1.144 D_IP=98.137.246.7 hostname=www.yahoo.com state=NO_MATCH drop_reason=NOT_WHITELISTED
```
#### AviatrixTunnelStatusChange
Logs with this prefix come from the Controller whenever a tunnel status changes.
old\_state means old state of the tunnel, and new\_state is the new changed state
of tunnel.
Example log:
```
2019-11-30T15:44:52.718808+00:00 ip-172-32-0-226 cloudxd: AviatrixTunnelStatusChange: src_gw=oregon-transit(AWS us-west-2) dst_gw=100.20.53.124(NA NA) old_state=Down new_state=Up
```
#### AviatrixCMD
Logs with this prefix come from the Controller whenever a CLI command is issued.
It contains information on the CLI command that was issued, the results of the
execution, reason a message if there is a failure and who issued the command.
Example log:
```
2019-11-19T20:13:44.585942+00:00 ip-172-32-0-226 cloudxd: AviatrixCMD: action=USERCONNECT_UPGRADE_TO_VERSION, argv=['--rtn_file', '/run/shm/rtn957594707', 'userconnect_upgrade_to_version', 'upgrade-status', ''], result=Success, reason=, username=admin
2019-11-19T18:01:59.796230+00:00 ip-172-32-0-226 cloudxd: AviatrixCMD: action=TRANSIT_SPOKE_LIST, argv=['--rtn_file', '/run/shm/rtn2091225061', 'transit_spoke_list', '--spoke_only'], result=Success, reason=, username=admin
```
#### AviatrixBGPOverlapCIDR
Log messages with this prefix come from the Controller whenever it detects
overlapping CIDRs between on-prem learned and Spoke VPC CIDRs.
Example log:
```
2018-09-24T20:28:58.330708+00:00 ip-172-31-23-128 cloudxd: AviatrixBGPOverlapCIDR: Time Detected: 2018-09-24 20:28:58.329881
Spoke/Manual CIDRs ['10.0.0.0/8'] have a conflict with BGP Learned CIDRs [u'10.2.0.0/16', u'30.2.0.0/16'] in VPC vpc-782bb21f on connection vgw-bgp-ha.
```
#### AviatrixBGPRouteLimitThreshold
Log messages with this prefix come from the Controller whenever it detects that
total BGP routes exceed the 80 routes. (AWS VGW has a total 100 route limit.)
Example log:
```
2018-09-24T20:24:50.600144+00:00 ip-172-31-23-128 cloudxd: AviatrixBGPRouteLimitThreshold: This message is alerting you that the VGW listed below currently has 89 routes, which is approaching the VGW route limits (100). You can reduce the number of routes on VGW both from on-prem side and on Aviatrix Transit gateway by enabling Route Summarization feature.
Time Detected: 2018-09-24 20:24:50.599822
Connection Name: vgw-bgp-ha
VGW Id: vgw-0942b724a5150bc6a
```
#### AviatrixGuardDuty
Log messages with this prefix come from the Controller whenever it receives an
alert message from AWS GuardDuty.
Example log:
```
2018-09-23T00:00:50.369963-07:00 ip-172-31-89-197 cloudxd: AviatrixGuardDuty: Account [aws], Region [us-east-1], Instance ID [i-0a675b03fafedd3f2], at 2018-09-23T02:05:35Z, 163.172.7.97 is performing SSH brute force attacks against i-0a675b03fafedd3f2. Please tighten instance security group to avoid UnauthorizedAccess:EC2/SSHBruteForce threat.
2018-09-23T00:00:50.332066-07:00 ip-172-31-89-197 cloudxd: AviatrixGuardDuty: Account [aws], Region [us-east-1], Instance ID [i-0a675b03fafedd3f2], at 2018-09-23T06:35:40Z, Unprotected port on EC2 instance i-0a675b03fafedd3f2 is being probed. Please tighten instance security group to avoid Recon:EC2/PortProbeUnprotectedPort threat.
```
#### AviatrixFireNet
Log messages with this prefix come from the Controller whenever a firewall
instance state changes.
Example log:
```
2019-11-19T09:38:40.070080-08:00 ip-172-31-93-101 cloudxd: AviatrixFireNet: Firewall i-021f23187b8ac81c9~~tran-fw-1 in FireNet VPC vpc-0f943cd05455358ac~~cal-transit-vpc-1 state has been changed to down.
2019-11-19T09:39:03.066869-08:00 ip-172-31-93-101 cloudxd: AviatrixFireNet: Firewall i-021f23187b8ac81c9~~tran-fw-1 in FireNet VPC vpc-0f943cd05455358ac~~cal-transit-vpc-1 state has been changed to unaccessible.
2019-11-19T09:40:12.878075-08:00 ip-172-31-93-101 cloudxd: AviatrixFireNet: Firewall i-021f23187b8ac81c9~~tran-fw-1 in FireNet VPC vpc-0f943cd05455358ac~~cal-transit-vpc-1 state has been changed to up.
```
#### AviatrixVPNVersion
Log messages with this prefix come from the Controller whenever it rejects an
Aviatrix VPN client connection.
Example log:
```
2020-02-07T11:38:48.276150-08:00 Controller-52.204.188.212 cloudxd: AviatrixVPNVersion: The VPN connection was rejected as it did not satisfy the minimum version requirements. Current version: AVPNC-2.4.10 Required minimum version: AVPNC-2.5.7 . The rejected VPN user name is tf-aws-52-tcplb-user1
```
#### AviatrixGatewayStatusChanged
These log messages will be seen from the Controller's syslogs when a gateway's
status changes
Example log:
```
2020-03-29T00:09:13.201669+00:00 ip-10-88-1-63 cloudxd: AviatrixGatewayStatusChanged: status=down gwname=EMEA-ENG-VPNGateway
```
## AWS CloudWatch Integration
Only AWS gateways and Controllers are supported. Other cloud types are not
supported. AWS gateways created from an access account with an AWS secret key
and access key are not supported.
### Configuring AWS CloudWatch
For Aviatrix Controllers and gateways in different AWS accounts to send/update
logs to the collector's AWS account, follow the instructions below to set up IAM
role and policies on the collector's AWS account.
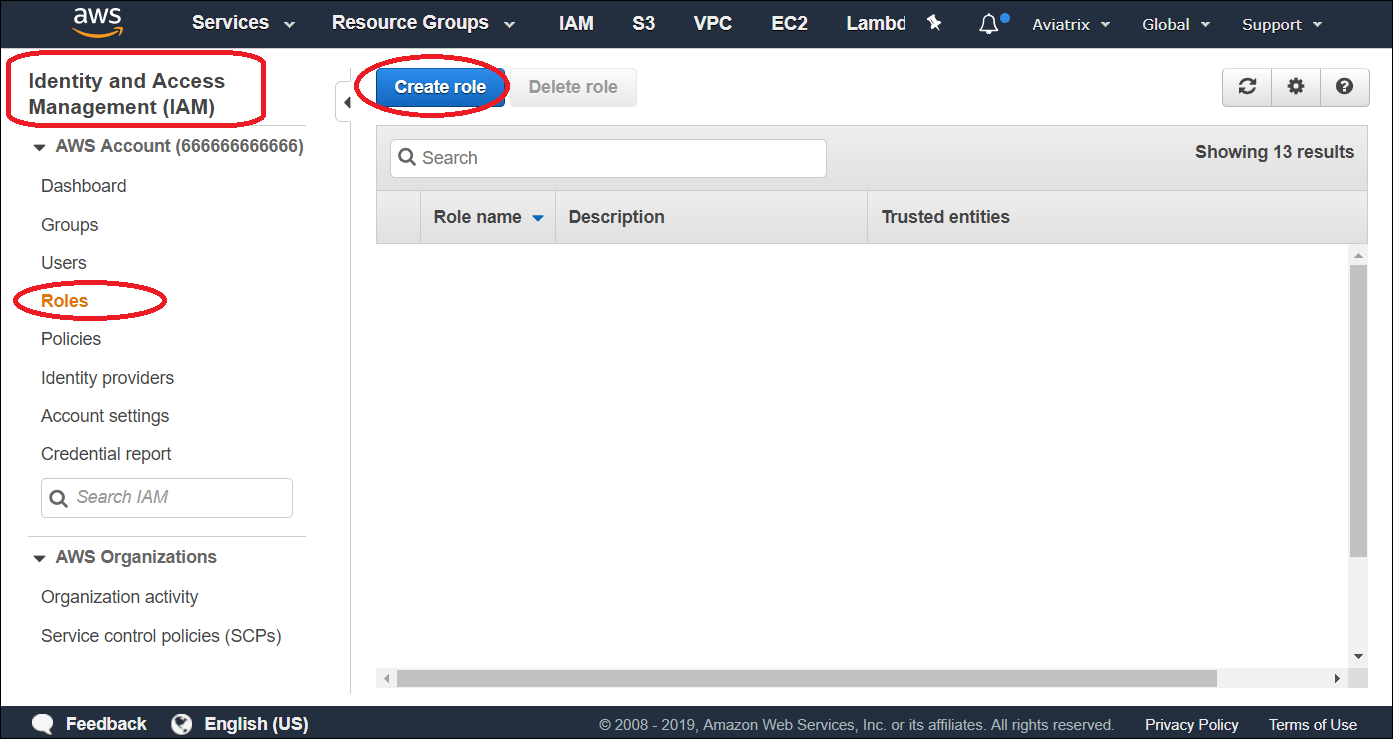
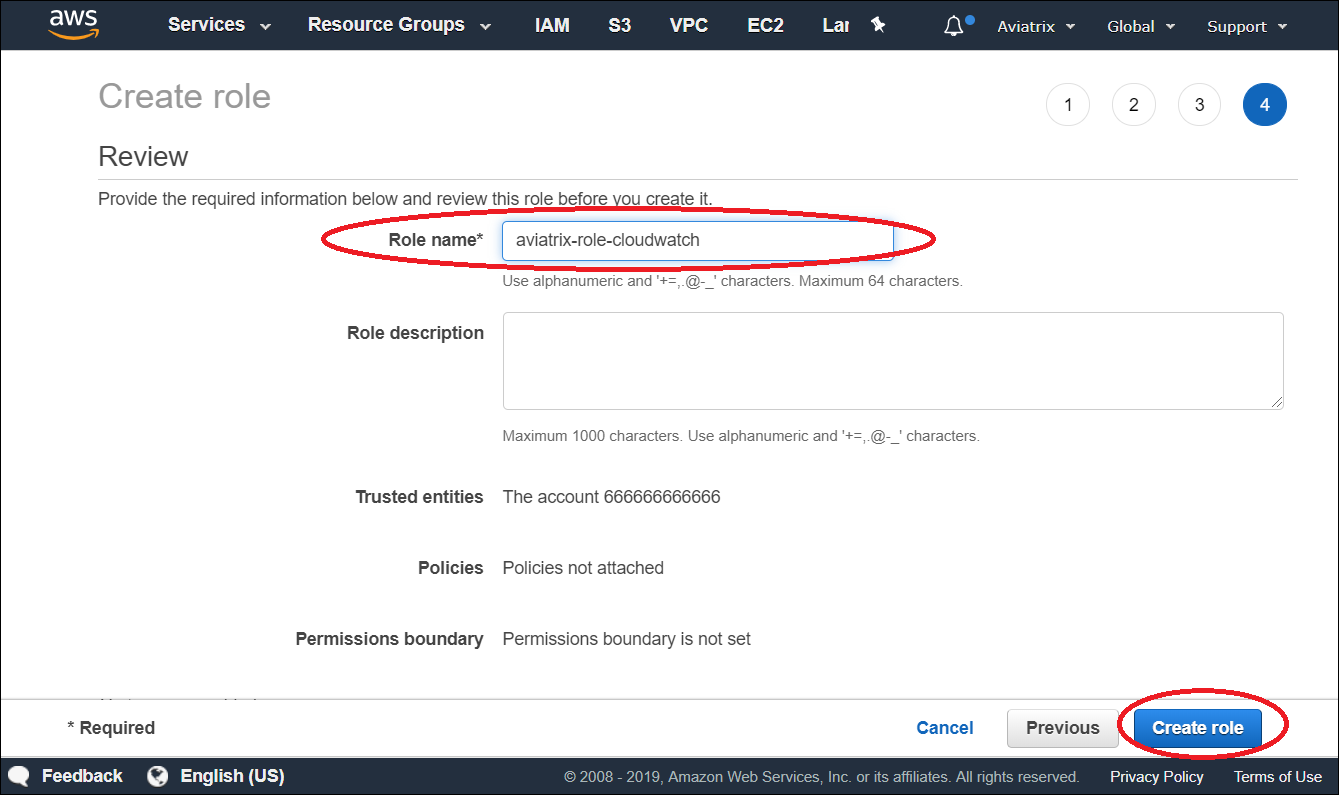
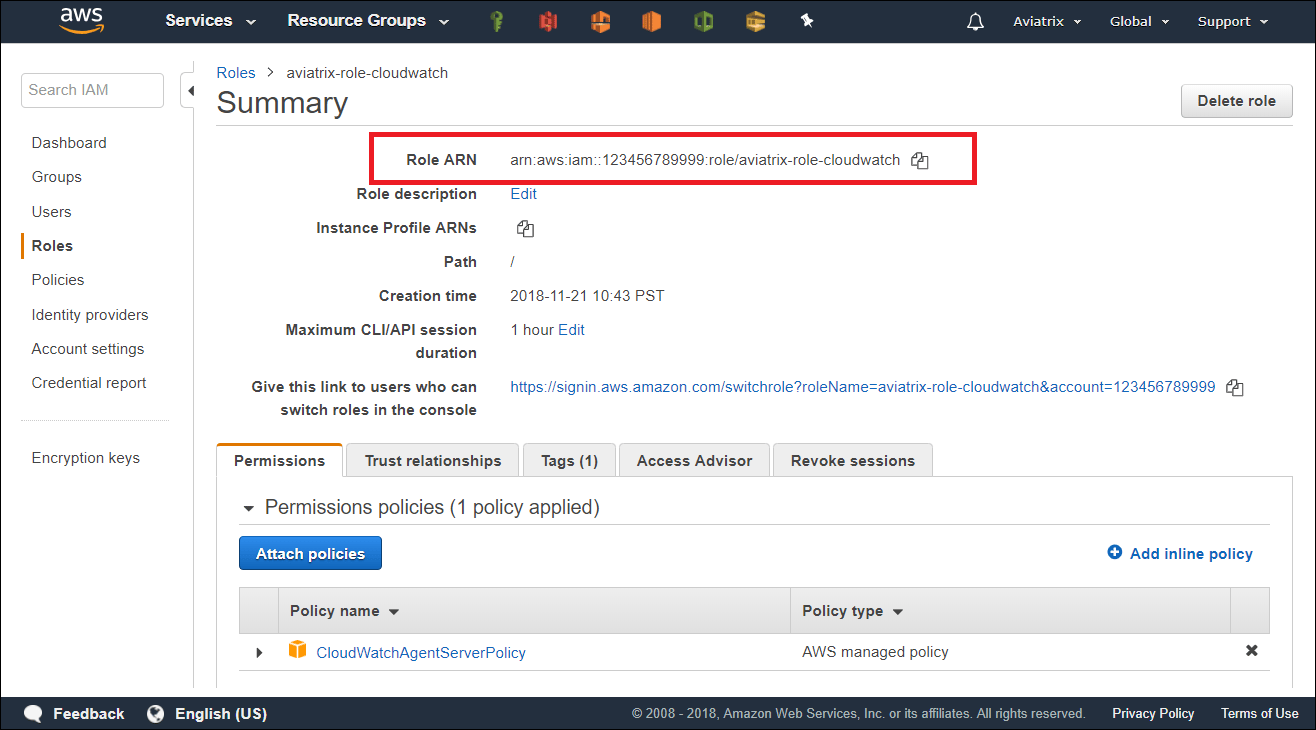
1. Go to AWS console, create an IAM role with a name aviatrix-role-cloudwatch.
2. Add Trust-Relationships for Aviatrix Controllers' and all gateways' AWS
accounts. If you are already using CloudWatch for logs from all your AWS
accounts, you may have already built the trust relationship between accounts.
If this is the case, skip this step.
3. Attach AWS IAM Cloudwatch policy to the role aviatrix-role-cloudwatch.
a: Create an IAM role aviatrix-role-cloudwatch, make sure the role name is
"aviatrix-role-cloudwatch".
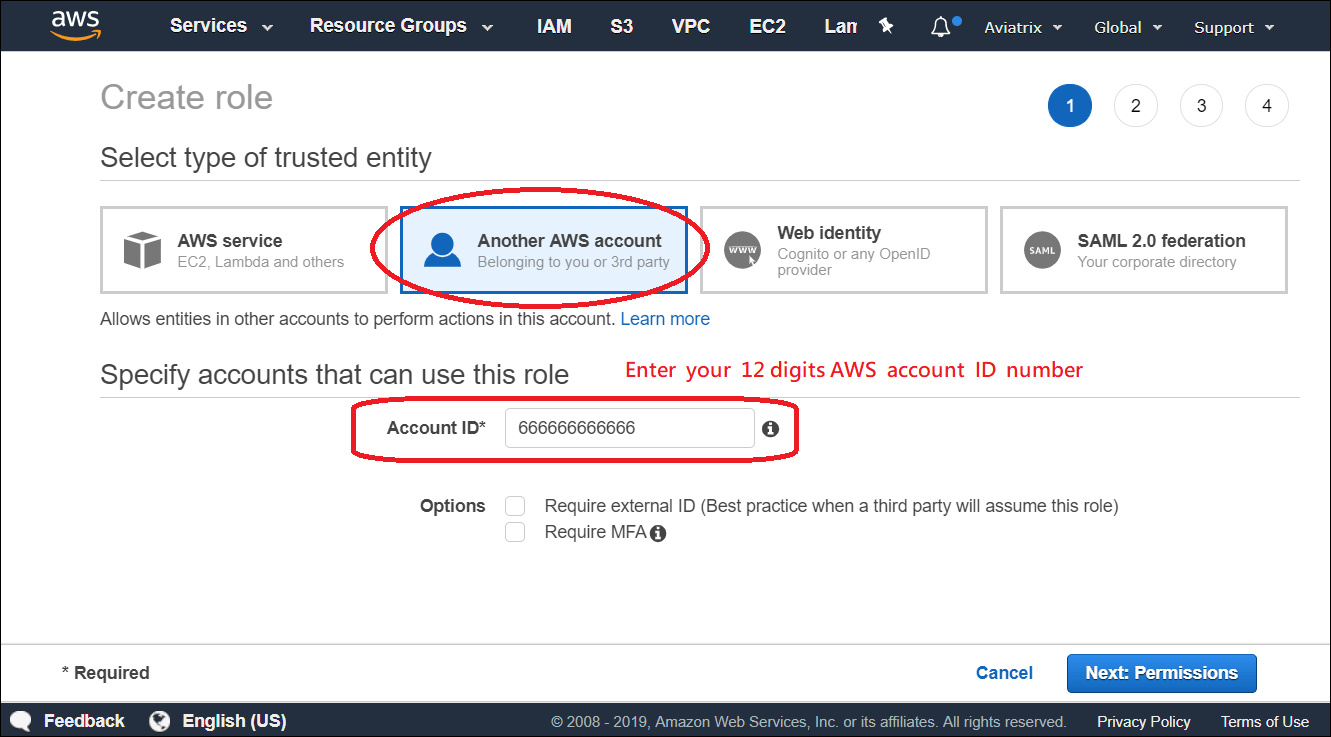
 b: Add Trust-Relationships for controllers and gateways AWS accounts

 c: Attach AWS IAM policy for "CloudWatchAgentServerPolicy" to the role
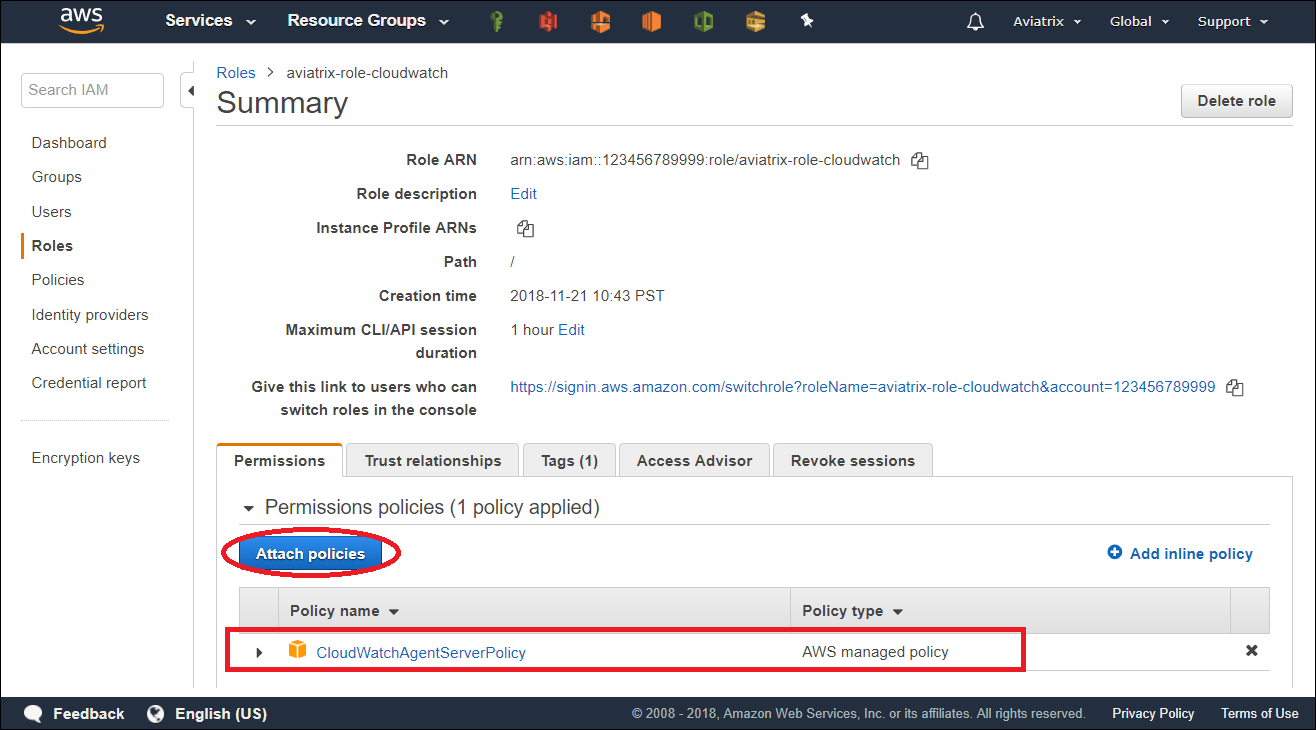 d: Retrieve the ARN of the IAM Role
 ### Enable CloudWatch log on the Controller
ARN of IAM role: Specify the ARN of the IAM role in the collector's AWS
account. \* Region: Specify which region you wish to store your logs.
### Enable CloudWatch log on the Controller
ARN of IAM role: Specify the ARN of the IAM role in the collector's AWS
account. \* Region: Specify which region you wish to store your logs.
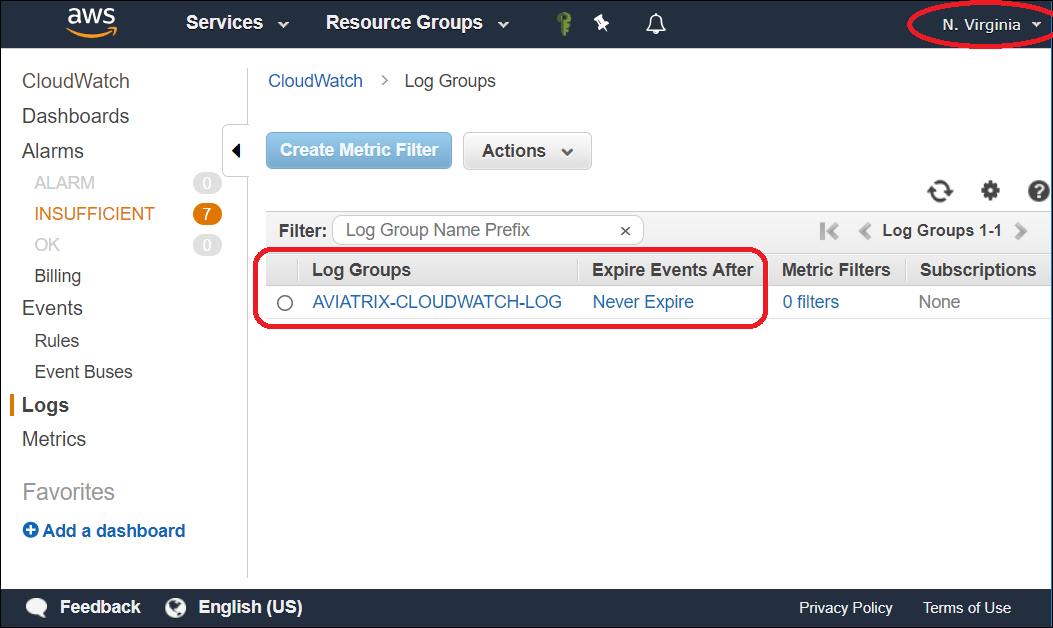
 ### Verifying your AWS CloudWatch integration
In AWS CloudWatch:
### Verifying your AWS CloudWatch integration
In AWS CloudWatch:
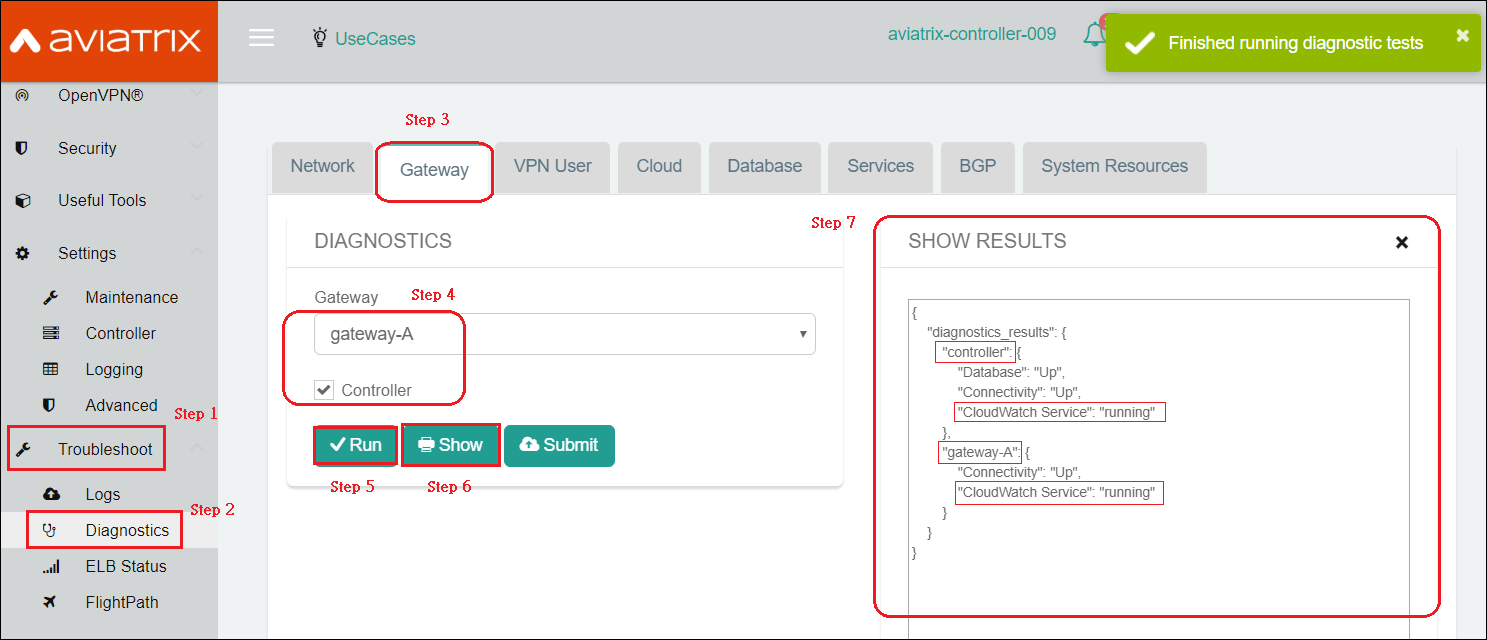
 To view the Aviatrix Controller's and Gateways' CloudWatch Service Status:
 Logs from CloudWatch can be exported to S3 buckets. Please see the [AWS
Documentation](https://docs.aws.amazon.com/AmazonCloudWatch/latest/logs/S3Export.html).
## Related Links for Log Collectors
Aviatrix supports using Remote Syslog (rsyslog) for forwarding log messages.
Most log collectors support rsyslog as a log forwarder. The following are links
related to log collectors and rsyslog:
* Sumo document about using rsyslog to send logs to Sumo
* Sumo document about creating a cloud syslog source on your collections
* Splunk document about creating a listener in Splunk
* Logstash document about creating a TCP listener in Logstash
* Controller High Availability in AWS
* [Aviatrix Log Formats](#aviatrix-log-formats)
Logs from CloudWatch can be exported to S3 buckets. Please see the [AWS
Documentation](https://docs.aws.amazon.com/AmazonCloudWatch/latest/logs/S3Export.html).
## Related Links for Log Collectors
Aviatrix supports using Remote Syslog (rsyslog) for forwarding log messages.
Most log collectors support rsyslog as a log forwarder. The following are links
related to log collectors and rsyslog:
* Sumo document about using rsyslog to send logs to Sumo
* Sumo document about creating a cloud syslog source on your collections
* Splunk document about creating a listener in Splunk
* Logstash document about creating a TCP listener in Logstash
* Controller High Availability in AWS
* [Aviatrix Log Formats](#aviatrix-log-formats)